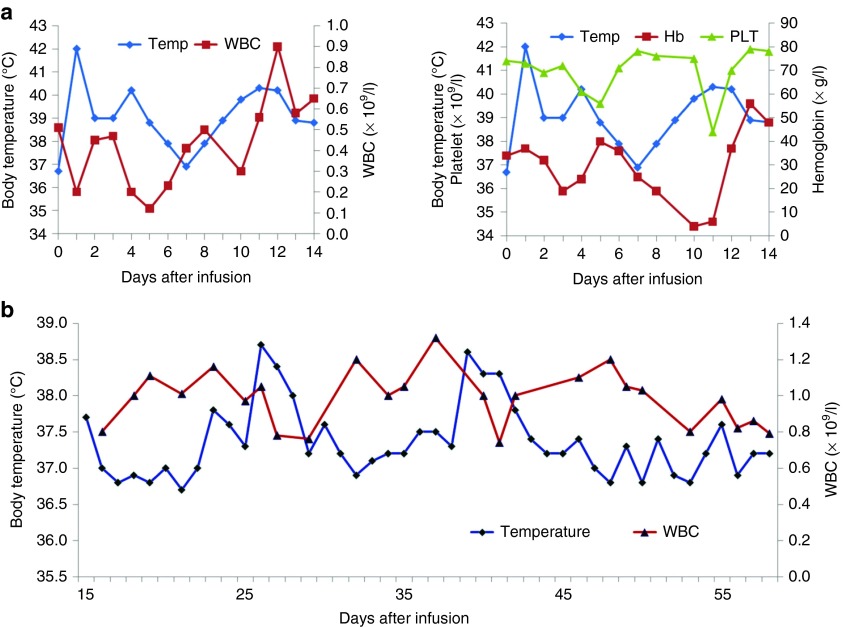
Figure 4.
Changes in the complete blood count and body temperature during and after the CART-33 cell infusion. (a) The left panel shows the alterations in the WBC count and body temperature, and the right panel shows the changes in the platelet count, hemoglobin level, and the patient's body temperature during the first 2 weeks of cell treatment. (b) Changes in the temperature and WBC count 2 weeks later. CART, chimeric antigen receptor-modified T cells; WBC, white blood cell.

