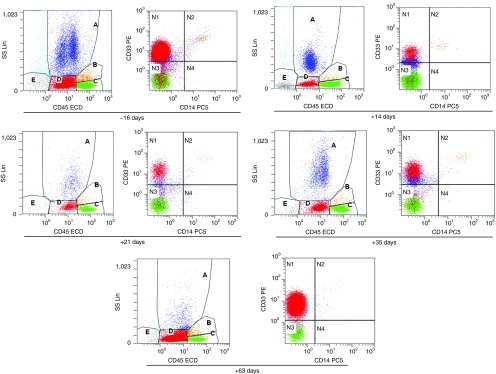
Figure 6.

FACS analysis for bone marrow aspirates. The cells in the D gate represent the blast population count corresponding to 61.66, 9.48, 28.24, 33.83, and 84.95%, respectively, of the total nucleated cells in the bone marrow aspirates collected at the indicated time points before and after the CART-33 infusions. CART, chimeric antigen receptor-modified T cells; FACS, fluorescent-activated cell sorting.
