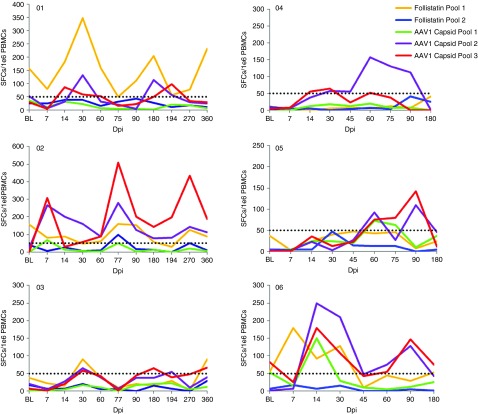
Figure 2.
Interferon-gamma (IFN-γ) ELISpot assays. The T cell immune responses to AAV1 capsid and follistatin are shown for each patient throughout the clinical trial. Spot forming cells (SFCs) per million peripheral blood mononuclear cells (PBMCs) are shown on the Y-axis, and days postinfection (dpi) on X-axis.

