
Figure 3.
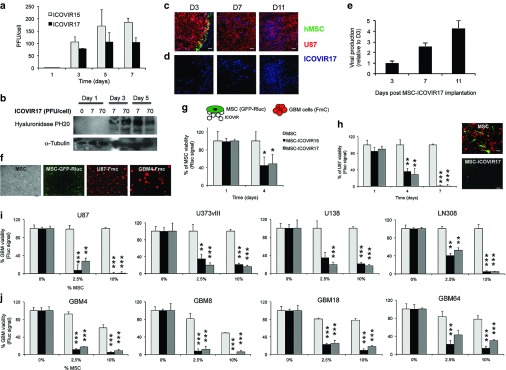
ICOVIR17 production and therapeutic effect of MSC loaded with ICOVIR17 in established and patient-derived GBM cells. (a) Human adipose stem cells (MSC) were infected with ICOVIR15 or ICOVIR17, and cells were collected at different time points. Plot showing virus production. (b) Western blotting analysis shows increased expression over time of hyaluronidase PH20 in MSC infected with ICOVIR17 at different multiplicity of infections (7 or 70 PFU/cell). (c,d) Mice bearing established intracranial U87-FmC tumors were treated with MSC expressing GFP loaded with ICOVIR17. Representative images of brain sections showing MSC in green, (c) U87 in red and (d) adenovirus staining in blue over time are shown. (e) Plot showing quantification of adenovirus staining areas over time. Bars, +SE (n = 2). (f) MSC and GBMs were engineered to express GFP-Rluc or Fluc-mCherry fusion markers, respectively. Photomicrograph showing MSC, modified MSC-GFP-Rluc, established GBM cell line U87-FmC, and patient-derived cell line GBM4-Fmc. Original magnifications: ×4. (g,h) MSC-GFP-Rluc were infected with ICOVIR15 or ICOVIR17 and cocultured with U87-FmC in a ratio of 1:10. Plots showing changes in (g) Rluc activity as a measure of MSC viability and (h) Fluc activity as a measure of tumor viability monitored over time. Photomicrographs showing cocultures of MSC-GFP-Rluc or MSC-GFP-Rluc-ICOVIR17 with U87-FmC at day 7. (i,j) A panel of (i) established and (j) patient-derived GBM lines expressing FmC were cocultured with increasing proportions of MSC, MSC-ICOVIR15, or MSC-ICOVIR17. Plots showing changes in Fluc signal as a measure of tumor viability. In all panels, Bars, +SD (n = 3). ***P < 0.001; **P < 0.01; *P < 0.05 versus MSC control (t-test, two-sided). Bar = 100 µm in c,d, 200 µm in f, and 100 µm in h.