Figure 5.
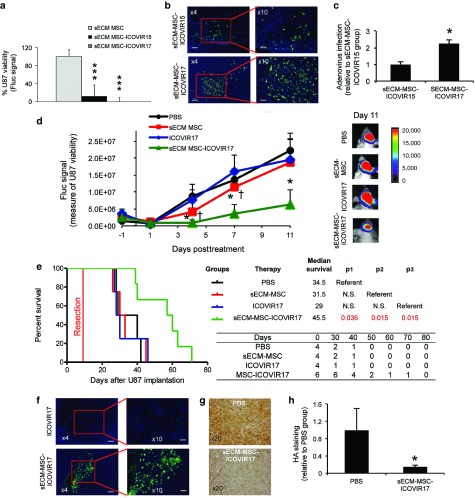
Therapeutic effect of sECM-encapsulated MSC-ICOVIR17 in a clinically relevant mouse model of GBM resection. (a) sECM encapsulated MSC, MSC-ICOVIR15, or MSC-ICOVIR17 were cocultured with U87-FmC. Plots showing tumor cell viability at day 7. (b,c) Mice bearing established intracranial U87-FmC tumors were treated intratumorally with sECM-MSC-ICOVIR15 or sECM-MSC-ICOVIR17, sacrificed at day 7 posttreatment, and adenovirus immunodetection was performed on brain sections from treated mice. (b) Representative images from adenovirus staining from each treated group are shown. (c) Plot showing quantification of adenovirus staining. (d–h). Mice bearing established intracranial U87-FmC tumors were resected and treated with intracavitary injections of PBS, sECM-encapsulated MSC, ICOVIR17, or sECM-encapsulated MSC-ICOVIR17. (d) Plot showing changes in Fluc activity as a measure of tumor growth monitored over time. Representative bioluminescence images from each group at day 11 after treatment are shown. (e) Kaplan–Meier survival curves of treated mice. Overall survival time was compared between groups. p1 represents P value when PBS-treated group is used as reference, p2 represents P value when sECM-MSC group serves as a reference, and p3 when ICOVIR17 is used as reference. The number of mice at risk is shown below the graph. (f–h) Analysis of adenovirus distribution and HA expression in U87 resected tumors at day 15 posttreatment. (f) Representative images showing adenovirus staining from ICOVIR17 or sECM-MSC-ICOVIR17 group. (g) Representative images showing HA staining from PBS and sECM-MSC-ICOVIR17 groups. (h) Plot showing quantification of HA levels. In vitro panel, Bars, +SD (n = 3). In vivo panels, Bars, +SE (n = 4–6) and ***P < 0.001 versus sECM-MSC control, *P < 0.05 versus PBS control, †P < 0.05 versus ICOVIR17 control (t-test, two-sided). Bar = 200 µm in b left, 100 µm in b right, 200 µm in f left, 100 µm in f right, and 50 µm in g.

