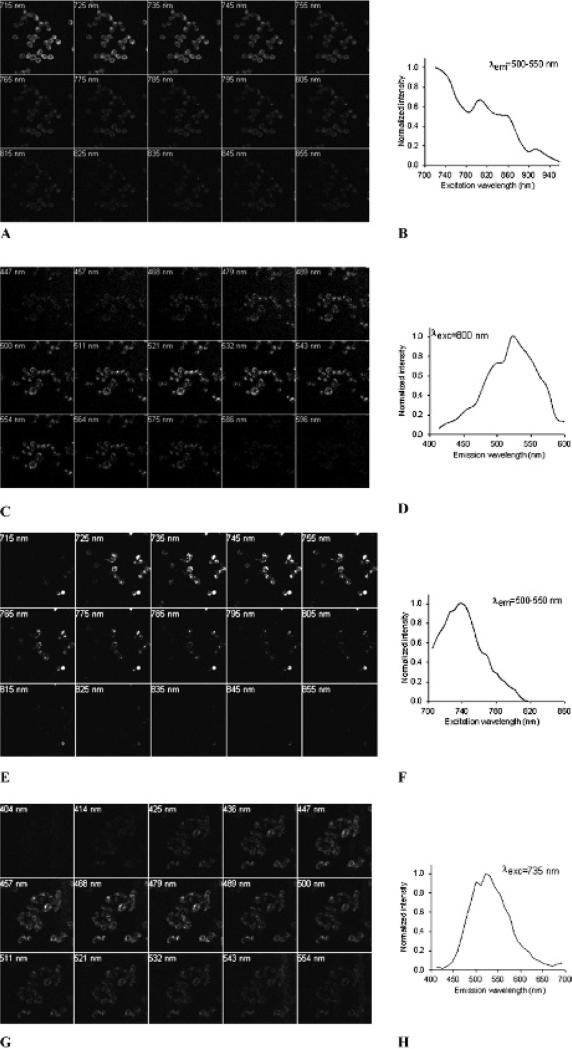
Figure 4.
In situ excitation and emission spectra of SW120 (A–D) and SW116 (E–H) in MDA-MB-435 cells determined with two-photon microscopy. A, Images of excitation spectra of SW120. B, An excitation spectra chart of SW120 displaying the normalized fluorescent intensity versus excitation wavelengths. C, Images of emission spectra of SW120. D, An emission spectra chart of SW120 displaying the normalized fluorescent intensity versus emission wavelengths. E, Images of excitation spectra of SW116. F, An excitation spectra chart of SW116 showing the normalized fluorescent intensity versus excitation wavelengths. G, Images of emission spectra of SW116. H, An emission spectra chart of SW116 showing the normalized fluorescent intensity versus emission wavelengths.

