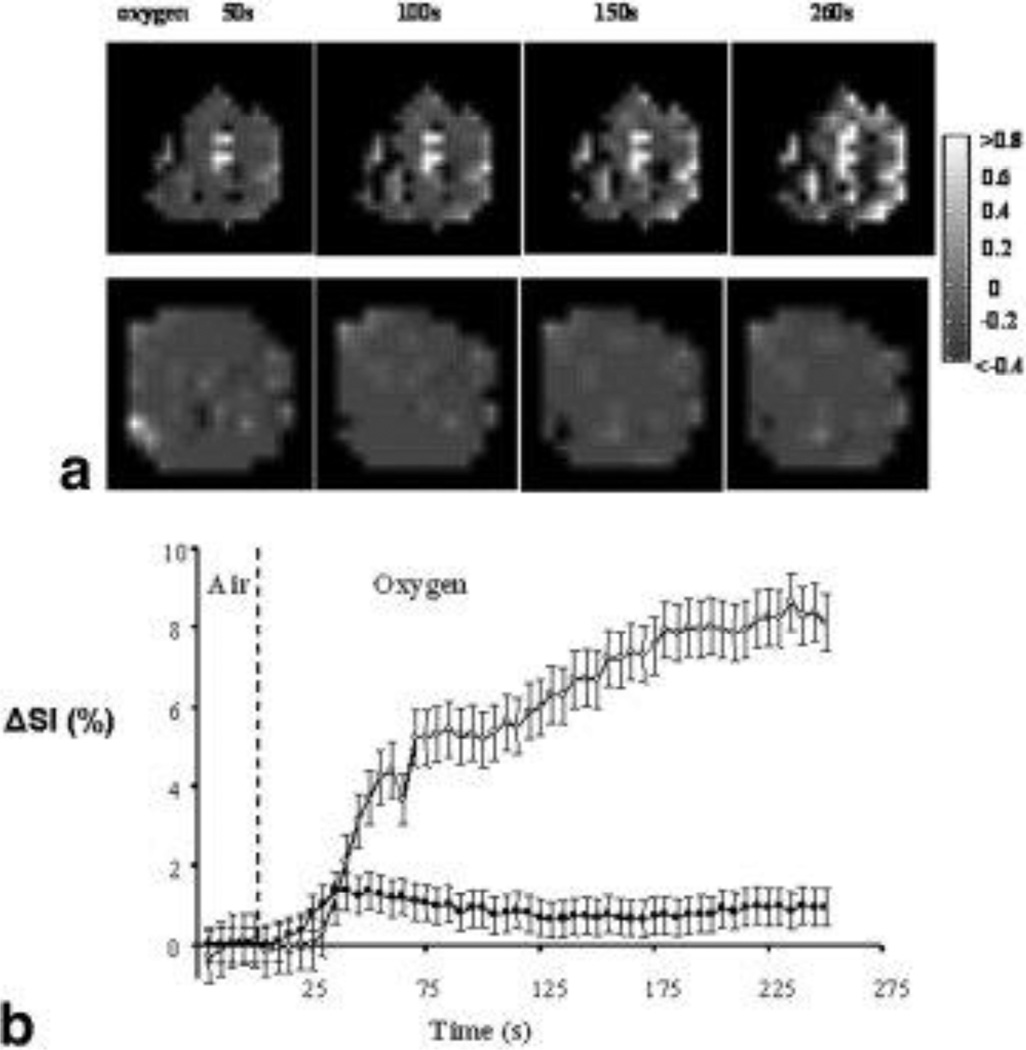
Figure 2. Variations in T2* weighted images with oxygen challenge (BOLD).
A. Normalized spin echo planar images of two tumors acquired at several time points after switching to oxygen breathing. In response to oxygen breathing the two tumors (upper, #2 0.4 cm3; lower, #6 1.4 cm3) showed heterogeneous signal enhancement. Regions of decreased signal intensity were also observed (dark regions).
B. Variations of normalized signal intensity change (ΔSI) versus time for these tumors with respect to oxygen challenge. Both tumors showed an initial rapid response. For tumor #2 (○) this became biphasic reaching a plateau with 9% increase after about 200 s of oxygen breathing. The second tumor (#6, ■) rapidly reached a peak value of ΔSI = 1.4% after 35 s, then gradually decreased to a plateau at about 0.5% increase. Data points are mean values ± standard error.

