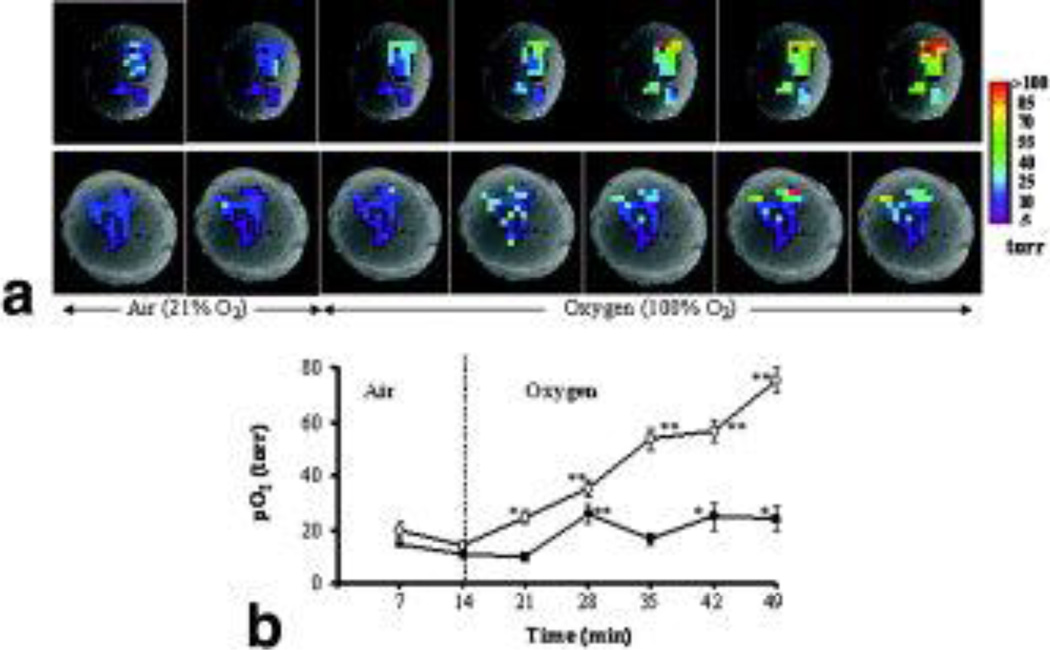
Figure 4. Variation of pO2 with oxygen challenge.
A. pO2 maps obtained at successive times overlaid on T1-weighted 1H images of two tumors (#2 and #6). A range of pO2 values was observed in both tumors under baseline conditions. In response to breathing oxygen, all the individual locations (34 voxels) in tumor # 2 (upper row) responded significantly and became well oxygenated. By contrast, some of initially hypoxic regions in tumor #6 (lower row) remained hypoxic, while others became well oxygenated.
B. Variation in mean pO2 of each tumor. Tumor #2 (○; mean baseline = 17 torr) showed significantly increased pO2 within 7 min of oxygen breathing, and continued to increase reaching 76 torr during the final measurement (49 min). Tumor #6 (■, mean baseline pO2 = 13 torr) reached a peak value (26 torr) after 14 min, but the settled back to a lower level. * p < 0.05; ** p < 0.001.

