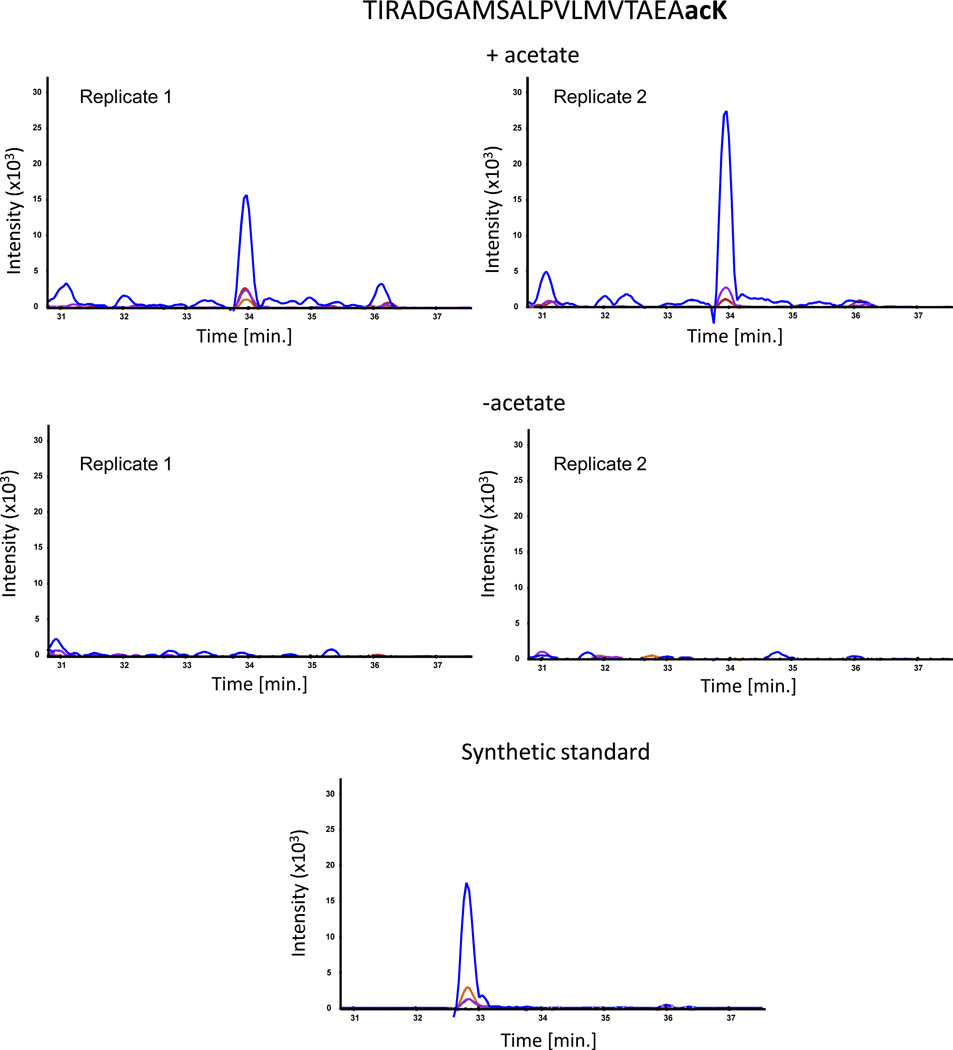
Fig. 1.
SRM mass spectrometry analysis of the acetylated peptide TIRADGAMSALPVLMVTAEAacK. The plots show overlaid chromatograms of the measured SRM transitions (product ions): b11 (blue), y10 (orange), b14 (purple) and b15 (red). The synthetic standard was external (not spiked directly into the sample), hence the slightly different retention time from the native peptide.

