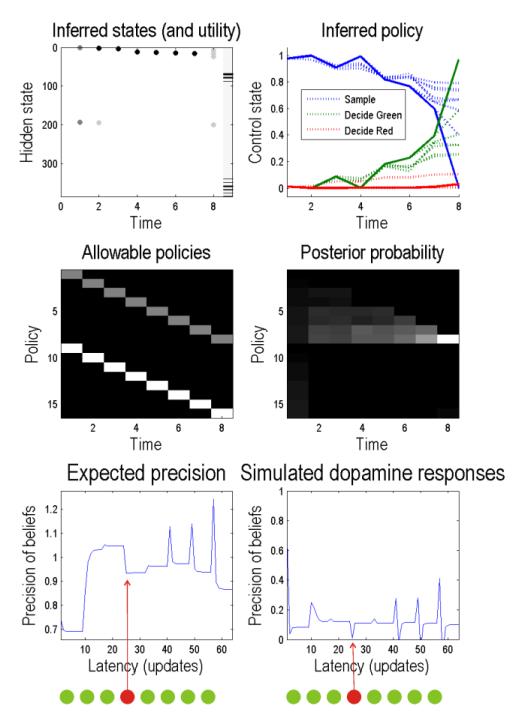
Figure 4.
This figure shows the results of a simulation of an eight draw game. Upper left: these show the inferred hidden states as a function of trial or draws. In this example, all the drawings returned green balls, apart from the fourth ball which was red. The image scale on the right of the graph indicates those final states that have a high utility or prior probability. Here, the agent was prevented from deciding until the last draw, where it chooses green. We delayed the decision to reveal the posterior beliefs about policies shown on the upper right: the solid lines correspond to the posterior expectation of waiting (blue) or deciding (red or green respectively). The dotted lines show the equivalent beliefs at earlier times. These probabilities are based upon the posterior expectations about policies shown in the middle two panels. Middle left: these are the allowable policies which, in this example, allow a decision at each of the eight trials. The corresponding posterior expectations are shown in the middle right panel in image format. It shows a progressive increase in the eighth policy that corresponds to a green choice on the final trial. The lower panels show the expected precision over trials. Lower left shows the precision (γ) as a function of variational updates (eight per trial). Simulated dopamine responses are shown on the lower left. These are the updates after deconvolution with an exponentially decaying kernel of eight updates. Both expected precision and simulated dopamine responses show increases after sampling information reinforcing currently held beliefs (here drawing a green ball after the first trial), and a decrease when sampling conflicting information (when a red ball is drawn on trial four).

