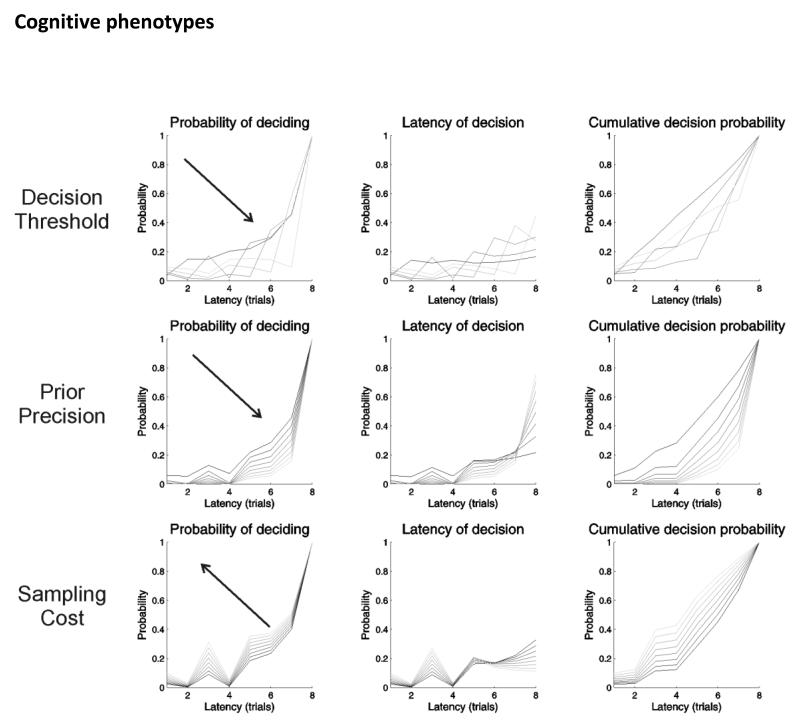
Figure 5.
these simulated results illustrate the effects of increasing the threshold criterion for decision (top row), prior precision (middle row) and sampling cost (bottom row) on the propensity to make an early decision. Upper panels: these show the probability of deciding as a function of the number of draws (latency) for increasing the decision threshold (from 0 to 8). The left panel shows the effects in terms of the probability of deciding, given no previous decision, the middle panel shows the corresponding distribution over latencies to a choice, and the right panel shows the cumulative probability of making a decision. (Lower thresholds are indicated by darker grey lines). Increasing the threshold or evidence required for a confident decision effectively delays the decision. Middle panels: these show the equivalent results when increasing the scale parameter of the prior beliefs about precision (from 2 to 16). (Lower prior precision values are indicated by darker grey lines) As confidence in policy selection increases, there is again a tendency to wait for more evidence. Bottom panels: these show the results when increasing the cost to sample w (from 0 to 1/8). (Lower sampling costs are indicated by darker grey lines) As sampling costs increase, the agent tends to decide at earlier time points.

