Figure 1.

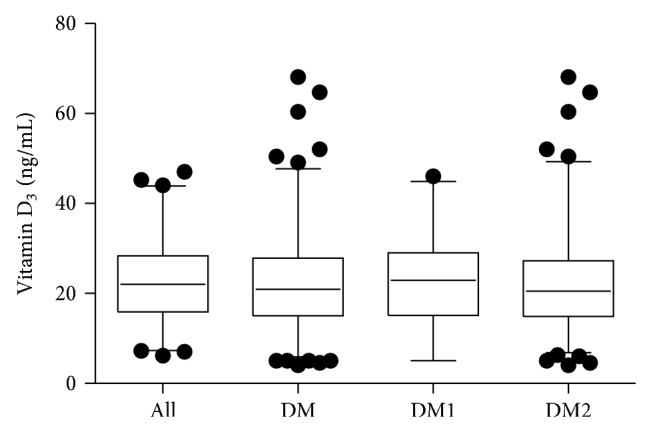
25(OH)D concentration in the controls, diabetic patients (DM), type 1 (DM1) or type 2 (DM2) diabetics. Data are presented as median, interquartile range, and 95% confidence interval (CI). Dots represent outliers beyond 95% CI.

25(OH)D concentration in the controls, diabetic patients (DM), type 1 (DM1) or type 2 (DM2) diabetics. Data are presented as median, interquartile range, and 95% confidence interval (CI). Dots represent outliers beyond 95% CI.