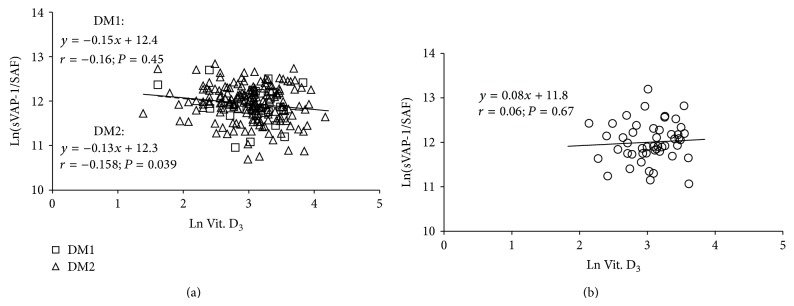
Figure 6.

Regression of ln(sVAP-1/SAF) over 25(OH)D concentration in type 1 and type 2 diabetics (a) and control subjects (b). DM1: type 1 diabetes mellitus; DM2: type 2 diabetes mellitus; dotted line represents a regression in cohort of type 1 diabetics; solid line represents a regression in cohort of type 2 diabetics.
