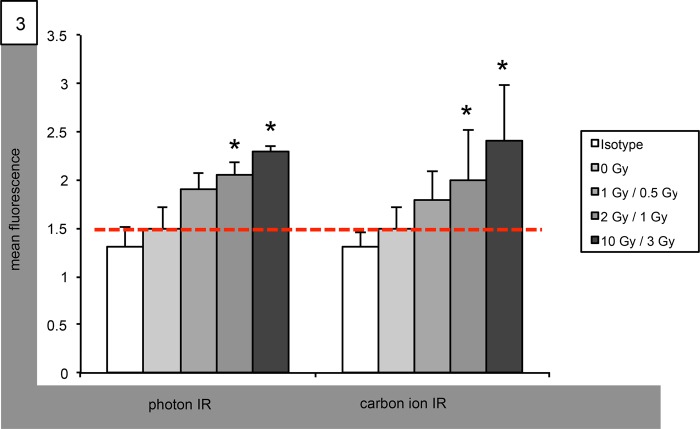
Fig. 3.
Radiation-altered expression of integrin α5 in Med8A medulloblastoma cells. Graphical FACS analysis of isotype-controlled integrin α5 surface expression following IR with single photon doses (left group) of 1, 2 and 10 Gy, and with single carbon ion doses (right group) of 0.5, 1 and 3 GyE. Statistical analysis performed using Student's t-test (asterisk indicates statistical significance P < 0.05, red bar references basal unirradiated control).

