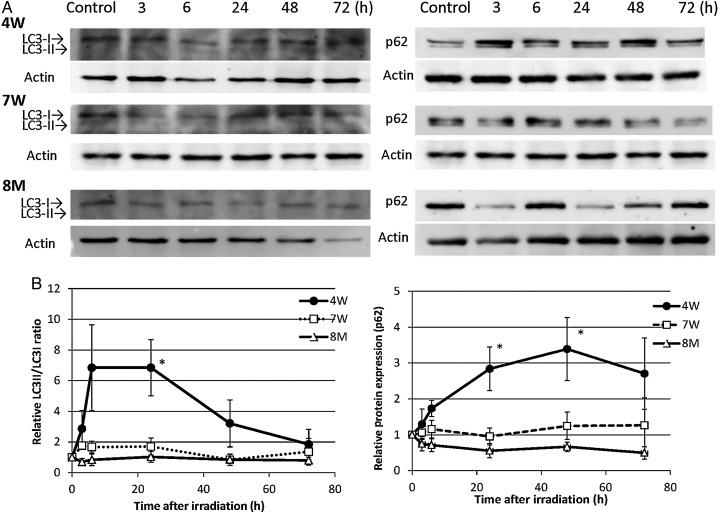
Fig. 5.
Western blots for LC3 and p62 in non-irradiated (control) and irradiated (3 to 72 h) 4W, 7W and 8M thyroid glands (A), and ratios of LC3-II to LC3-I and expression of p62 (B). LC3-II/LC3-I ratios in irradiated thyroids were normalized to LC-II/LC3-I ratios in non-irradiated controls. p62 levels were normalized to actin levels and are expressed as the ratio of the irradiated value to the non-irradiated value. Data are presented as the mean ± standard error of the mean of the results for three to seven rats per datapoint. * indicates P < 0.05 compared with 8M thyroids.

