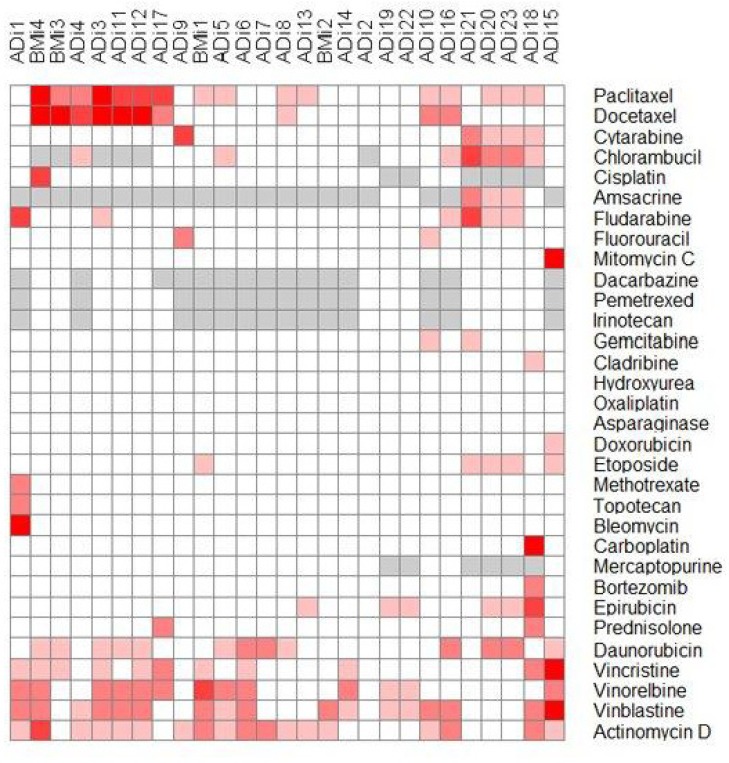
Figure 2. Heat map representation of the hierarchical clustering of drug sensitivity data of the individual primary cells against all drugs.
Intensity of the red color shows the sensitivity. White represents resistant and the intensity of the red color are proportional to the effect of the drug. Grey color means that the drug has not to be tested on this sample ADi1-23: adenocarcinoma cell isolates, BMi1-4: benign cell isolates.

