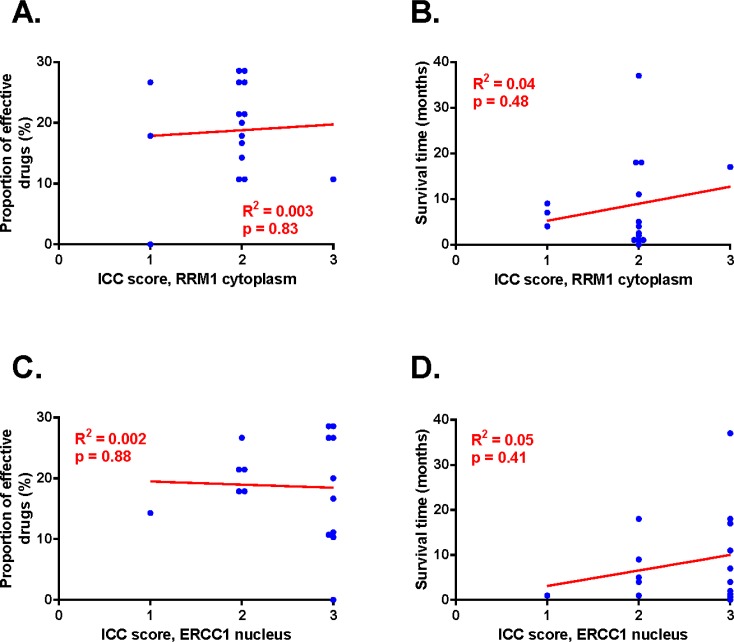
Figure 5. RRM1 and ERCC1 immunoreactivity correlated to proportion of effective drugs and survival time.
A: Proportion of effective drugs plotted against RRM1 staining. B: Survival time plotted against RRM1. C: Proportion of effective drugs plotted against ERCC1 staining. D: Survival time plotted against ERCC1. Regression analyses presented in red, data points for each patient in blue. Statistically significant departure of the slope from 0 was accepted at p<0.05 and was not seen.

