
Figure 3.
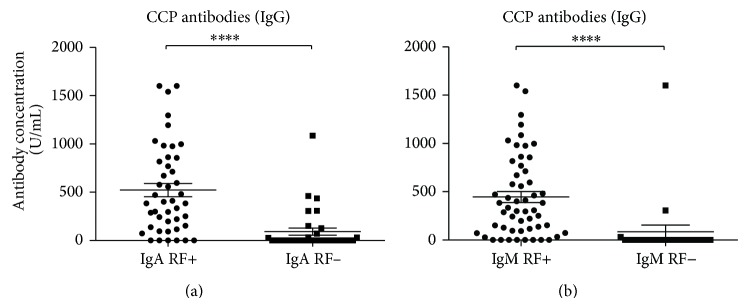
Scattergrams showing CCP antibodies from RA patients divided into IgA or IgM RF positives and negatives. (a) CCP antibodies divided into IgA RF states, IgA RF positives (n = 44) and IgA RF negatives (n = 33). (b) CCP antibodies divided into IgM RF states, IgM RF positives (n = 54) and IgM RF negatives (n = 23). RA patients total (n = 77). The RF positives and negatives were compared using the Mann-Whitney test. Data are presented as mean ± SEM. Concentrations of antibodies are presented in arbitrary units. Statistical significant differences are indicated with ∗, ∗∗, ∗∗∗, or ∗∗∗∗ for P values less than 0.05, 0.01, 0.001, or 0.0001, respectively.