
FIGURE 5. CD69 is an imperfect marker of tissue residence.
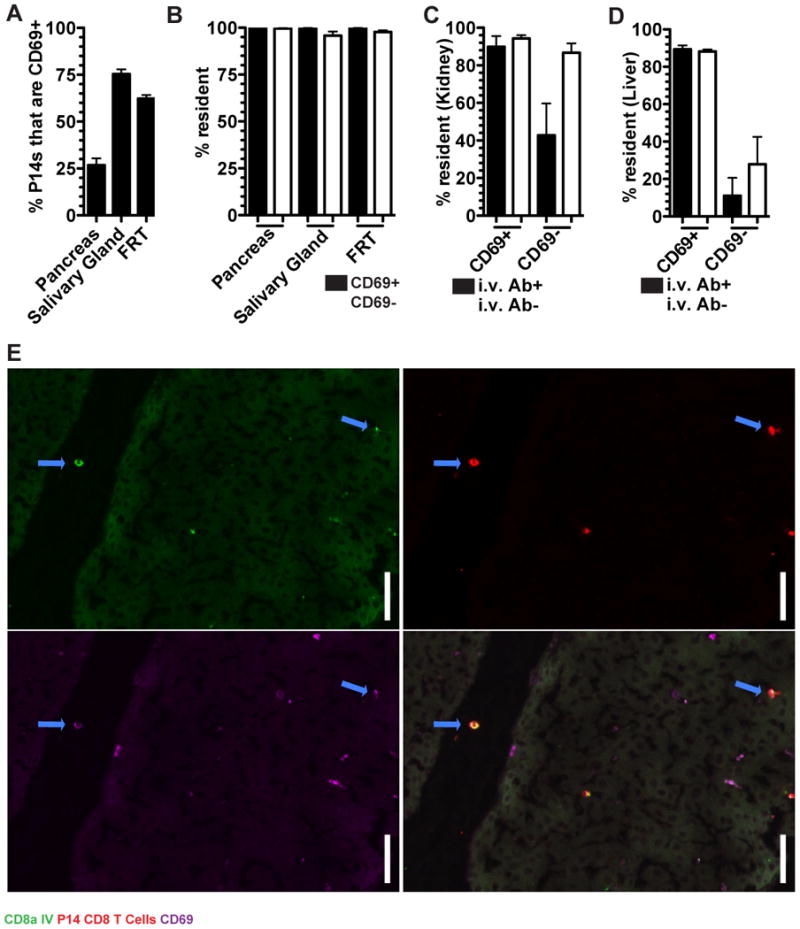
(A) P14 CD8 T cells from immune parabionts were analyzed for the expression of CD69 in the pancreas, salivary gland and FRT by QIM. (B) The fraction of CD69+ and CD69- P14 CD8 T cells that were resident. (C) The percent of P14 CD8 T cells that were resident among i.v. Ab+/- and CD69+/- in the kidney and (D) liver. (E) Representative image of a CD69+ i.v. Ab+ P14 CD8 T cells in a large vessel in the liver. α-CD8α i.v. Ab (green), P14 CD8 T cells (red), and CD69 (purple). Blue arrows indicate α-CD8α i.v. Ab+ CD69+ P14 CD8 T cells, scale bar =20μm. n=3, representative of 9 mouse pairs from 3 independent experiments. Graphs show mean and SEM, (See also Figure S2).