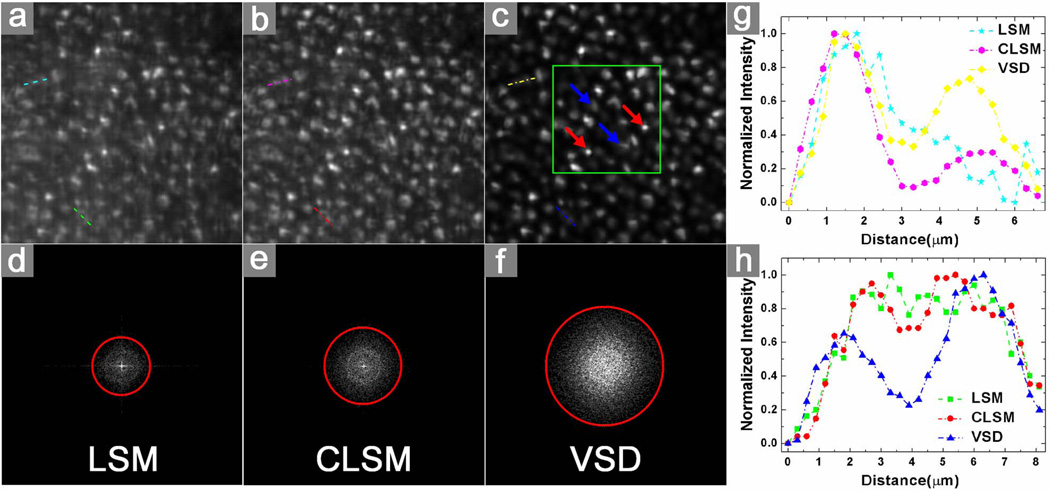
Fig. 3.
Comparison of three different imaging results using a living frog eyecup: (a) by conventional LSM, (b) by confocal LSM, and (c) by VSD reconstruction. The selected field of view was ~80 μm × 80 μm. The green color window in (c) marks the region of interest shown in greater detail in Fig. 4(a). The corresponding results in Fourier domain are shown, respectively, in (d)–(f). The measured frequency cutoff boundaries of the functions are delineated with red circles. (g) The normalized intensity profile of the selected adjacent photoreceptors (along upper lines) in (a), (b), and (c) are plotted, respectively. (h) The normalized intensity profile of the selected adjacent photoreceptors (along lower lines) in (a), (b), and (c) are plotted, respectively.

