. 2015 Apr 14;4:e05531. doi: 10.7554/eLife.05531

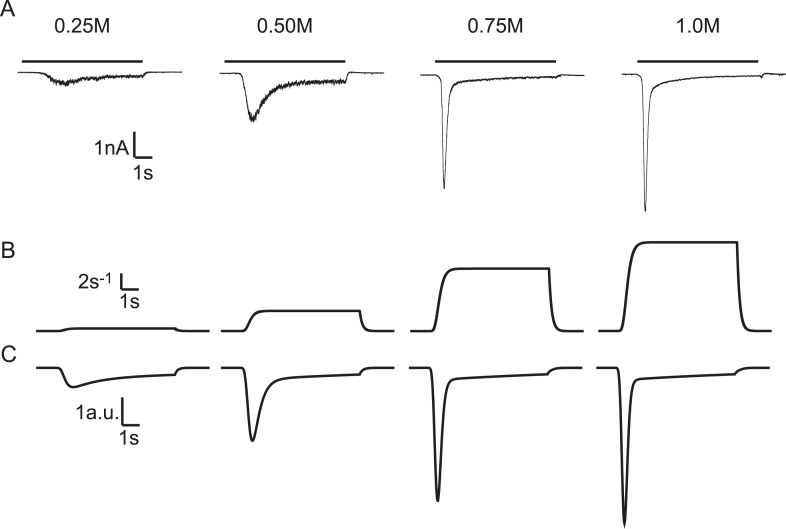
Figure 2. Modelling HS-induced EPSCs.

(A) Concentration dependence of HS-induced release kinetics. (B) Model simulations of time courses of k2, for different values of k2,max and (C) corresponding synaptic responses (−k2R).

DOI: http://dx.doi.org/10.7554/eLife.05531.004

Figure 2—source data 1. Parameter values for Figure 2—figure supplements 1 and, 3.
elife05531s001.docx (19.2KB, docx)
DOI: 10.7554/eLife.05531.005

Figure 2.

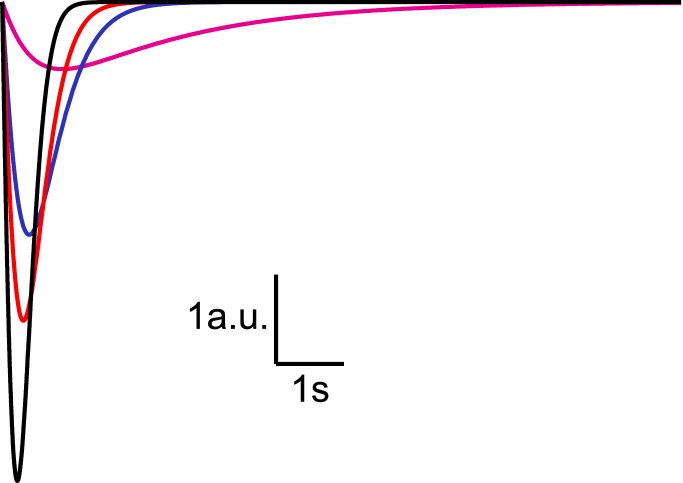
Figure 2—figure supplement 1. Analytical solution for hypertonic sucrose-induced release from a RRP without replenishment.

Figure 2—figure supplement 1.

Current responses obtained from Equation (14) after convolution with a typical mEPSC. The magenta line corresponds to k2,max = 0.5 s−1, blue to k2,max = 3 s−1, red to k2,max = 5 s−1, and black to k2,max = 10 s−1.
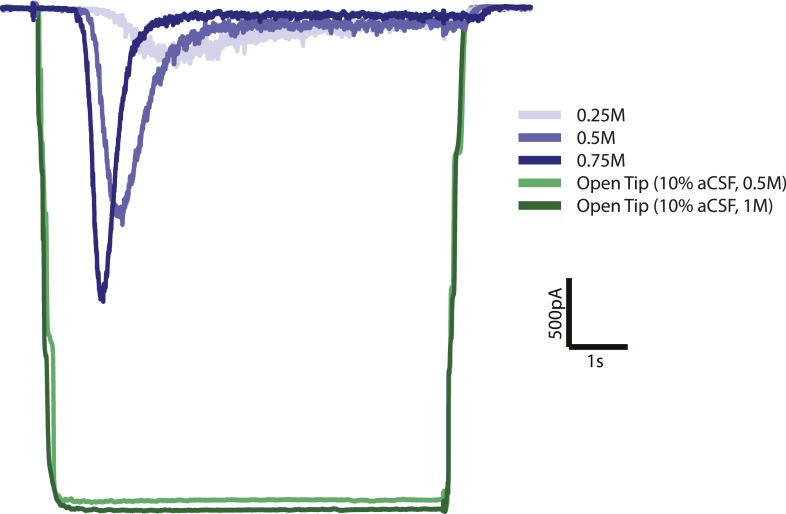
Figure 2—figure supplement 2. Open tip experiments show rapid solution exchange.

Figure 2—figure supplement 2.

Solution exchange was measured by the change in holding current when switching from normal (0.3M) extracellular solution to 10 times diluted (0.03M) extracellular solution with 0.5 or 1M sucrose. Green curves are the average responses for 6 recordings, corrected for baseline and inverted for displaying purposes. Blue curves represent postsynaptic current responses to different sucrose concentrations which show a delayed response with respect to the sucrose stimulus.
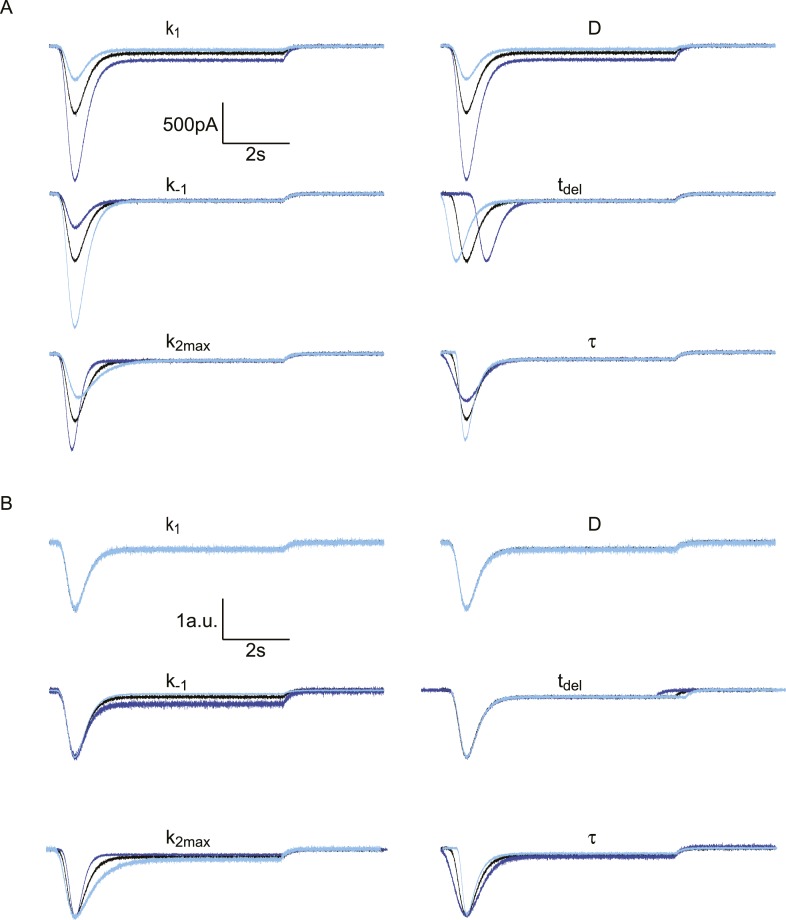
Figure 2—figure supplement 3. Effect of different model parameters on simulated HS-induced EPSCs.

Figure 2—figure supplement 3.

The default parameter set, represented by the black traces, is [k1,k1,k2,max,tdel,τ,D]=[0.09,0.16,3.5,0.60,0.20,1000]. In each subpanel, one of these parameters is either multiplied by 2 (dark blue) or divided by 2 (light blue). The Gaussian white noise added to these curves was generated using the MATLAB ‘randn()’ function, with µ = 0 pA and σ = 10 pA. (A) Absolute traces. (B) Traces scaled and aligned to peak.