. 2015 Apr 14;4:e05531. doi: 10.7554/eLife.05531

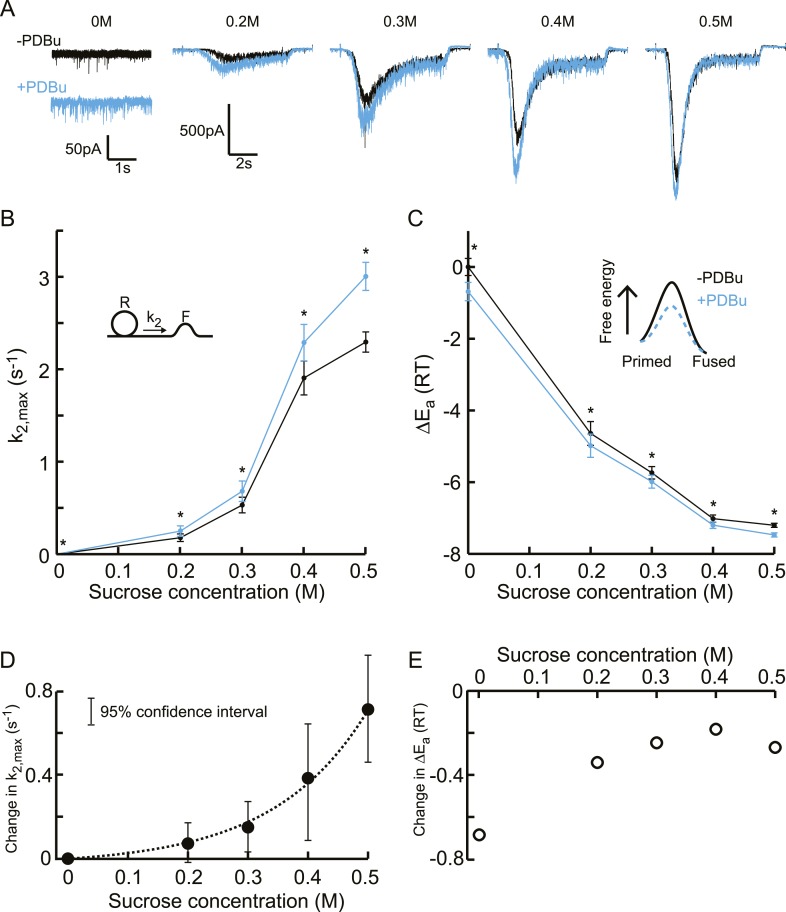
Figure 6. Additive effect on the activation energy for fusion induced by PDBu causes supralinear effect on release kinetics.

(A) Current traces, (B) release rate constants k2,max, and (C) activation energies for fusion at different sucrose concentrations in the absence and presence of PDBu. PDBu-induced changes in k2,max and ΔEa, obtained by subtraction of the data curves in B and C before and after PDBu application, show (D) an exponential increase in k2,max for increasing sucrose concentrations whereas (E) the changes in the energy domain are in the same order of magnitude (reduction at 0M is probably an overestimation due to Ca2+ depenence of the spontaneous release, [see text]). Mean values of k2,max displayed are all within the 95% confidence interval as determined by Bootstrap analysis.

DOI: http://dx.doi.org/10.7554/eLife.05531.022

Figure 6—source data 1. Parameter values for Figure 6B–E, bootstrap analysis Figure 6, Figure 6—figure supplement 3A–D, and Figure 6—figure supplement 3.
elife05531s006.docx (33.6KB, docx)
DOI: 10.7554/eLife.05531.023

Figure 6.

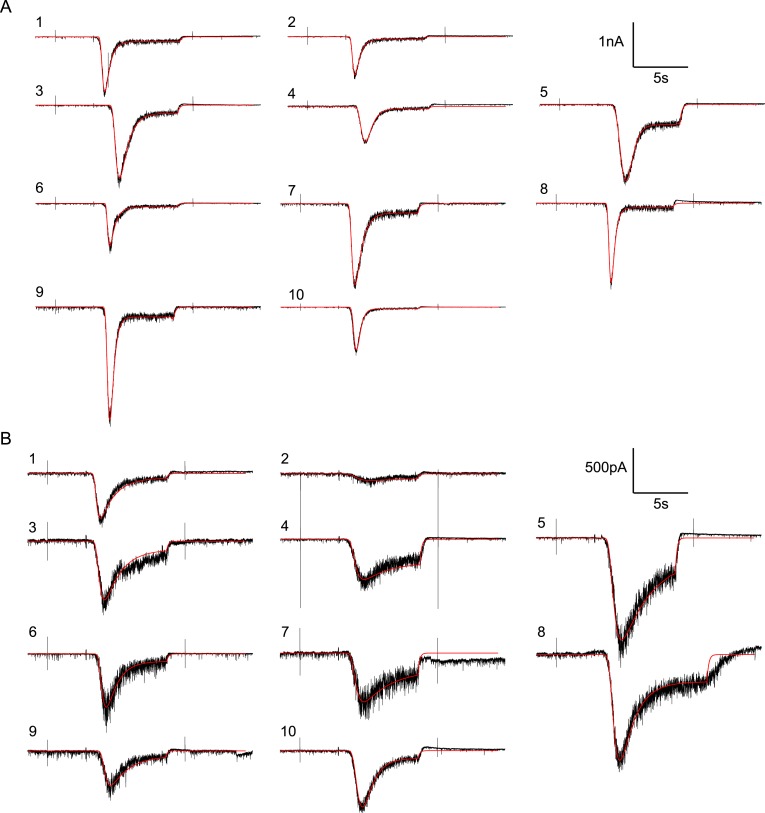
Figure 6—figure supplement 1. Random examples of individual HS-evoked EPSCs (black) in the absence of PDBu, overlaid with their best fit (red).

Figure 6—figure supplement 1.

(A) Responses to 0.5M. (B) Responses to 0.3M.
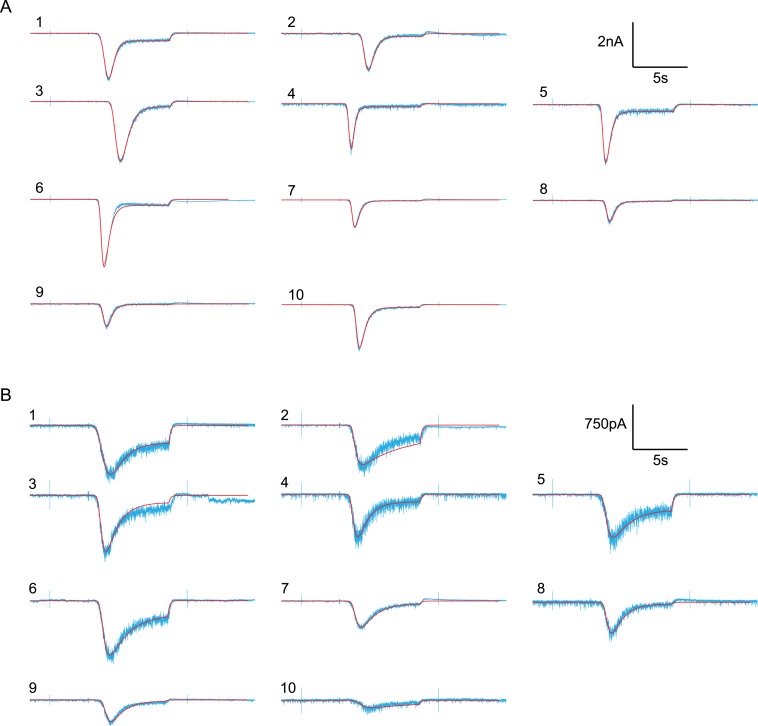
Figure 6—figure supplement 2. Random examples of individual HS-evoked EPSCs (blue) in the presence of PDBu, overlaid with their best fit (red).

Figure 6—figure supplement 2.

(A) Responses to 0.5M. (B) Responses to 0.3M.
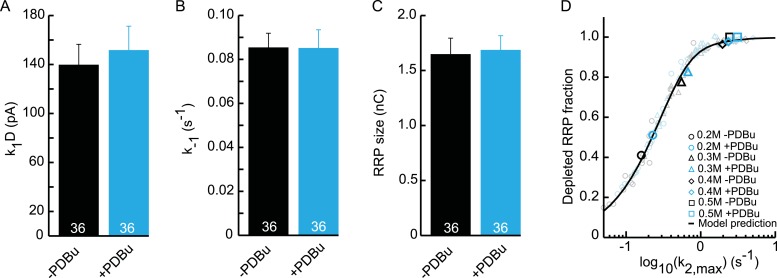
Figure 6—figure supplement 3. Upstream parameters and RRP size are not affected by PDBu application.

Figure 6—figure supplement 3.

(A) Priming rate k1D. (B) Unpriming rate constant k−1. (C) RRP size. (D) Relation between k2,max and depleted RRP is maintained in the presence of PDBu, but synaptic responses to submaximal HS-stimulation display faster kinetics and more RRP depletion.