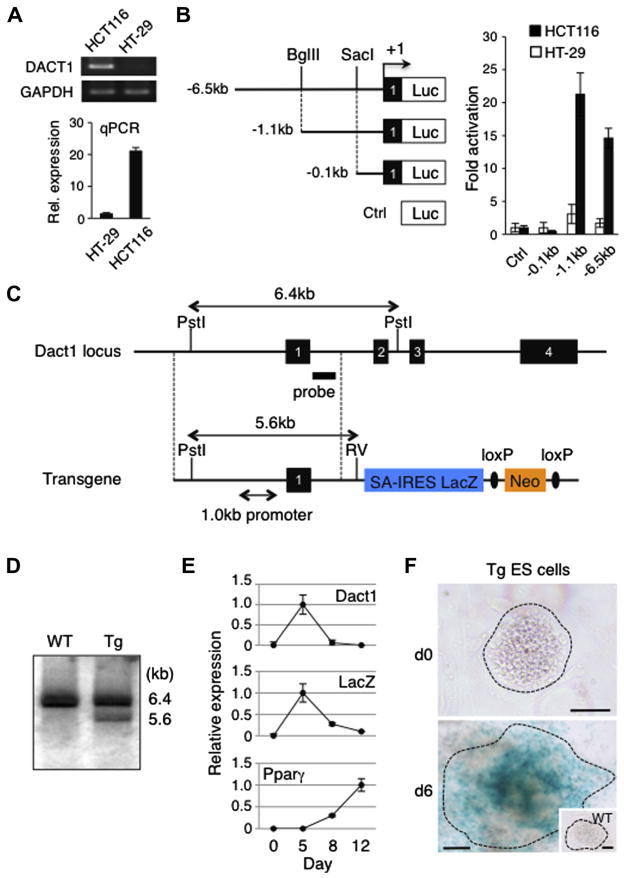
Fig. 1.
Characterization of the Dact1 gene promoter and Tg ES cells used for the generation of Dact1LacZ reporter mice. (A) Evaluation of the DACT1 gene expression in two colorectal cancer cell lines. Differential expression of the DACT1 gene in HCT116 and HT-29 cells was determined by semi-quantitative RT-PCR, followed by gel electrophoresis and staining with ethidium bromide (top) and real-time PCR (qPCR), expressed as the mean ± s.d. (bottom). In both RT-PCR and qPCR, expression of GAPDH served as an internal control. (B) Reporter assays with Dact1 gene promoter constructs. A series of Firefly luciferase reporter constructs were co-transfected with a Renilla luciferase control plasmid into HCT116 and HT-29 cells. Forty-eight hours after transfection, luciferase activities were measured and Firefly luciferase activity was normalized to that of Renilla luciferase. Data shown are the mean ± s.d. from three independent experiments. Luc, a promoter-less luciferase cassette; +1, transcription initiation site within exon 1 of the Dact1 gene; Ctrl, control. (C) Endogenous Dact1 allele (top) and a transgenic construct (bottom) used for the generation of Dact1LacZ Tg mice. The transgene contains a 6.0 kb fragment homologous to the endogenous Dact1 locus (indicated by dotted lines) including the 1.0 kb Dact1 promoter region, followed by a reading frame-independent LacZ gene cassette composed of an En2 splice acceptor (SA), internal ribosomal entry site (IRES) and β-galactosidase cDNA with SV40 poly A (LacZ), and a neomycin resistant gene cassette (Neo) flanked by loxP sites (ovals). Dact1LacZ-neo Tg mice were crossed with Actβ-Cre Tg mice to delete the Neo cassette, generating Dact1LacZ Tg mice. Solid boxes with numbers, Dact1 exons 1–4; RV, EcoRV. (D) Southern blot analysis. Genomic DNAs from WT and Tg ES cells were digested with Pst I and EcoRV and hybridized with a DNA probe shown in (C). (E) Real-time PCR analysis of Dact1, Dact1-LacZ and Pparγ expression in Tg ES cells upon differentiation into the adipogenic lineage. Expression of each gene was normalized to Rps18 transcript levels. The highest expression was set at 1.0 and data shown are the mean ± s.d. from three independent experiments. (F) Dact1-LacZ activities as determined by X-gal staining of Tg ES cells before and after differentiation into the adipogenic lineage. WT ES cells were used as a negative control (inset). Data shown are representative of three independent experiments with similar results. Bars = 100 μm.

