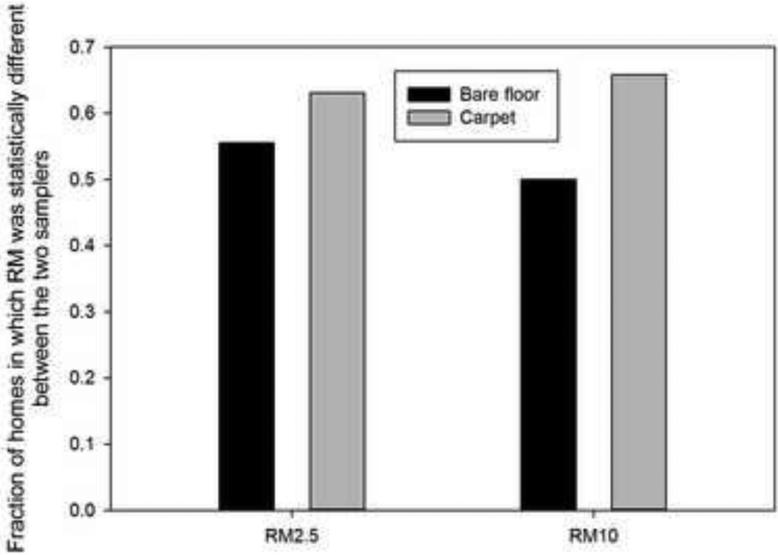
Figure 6.
Comparison of the fraction of homes for which the average RM value was significantly different (p < 0.05) between the two samplers. RM is the ratio of estimated mass while PIPER was moving to estimated mass during reference period (Equations 3 and 4).

