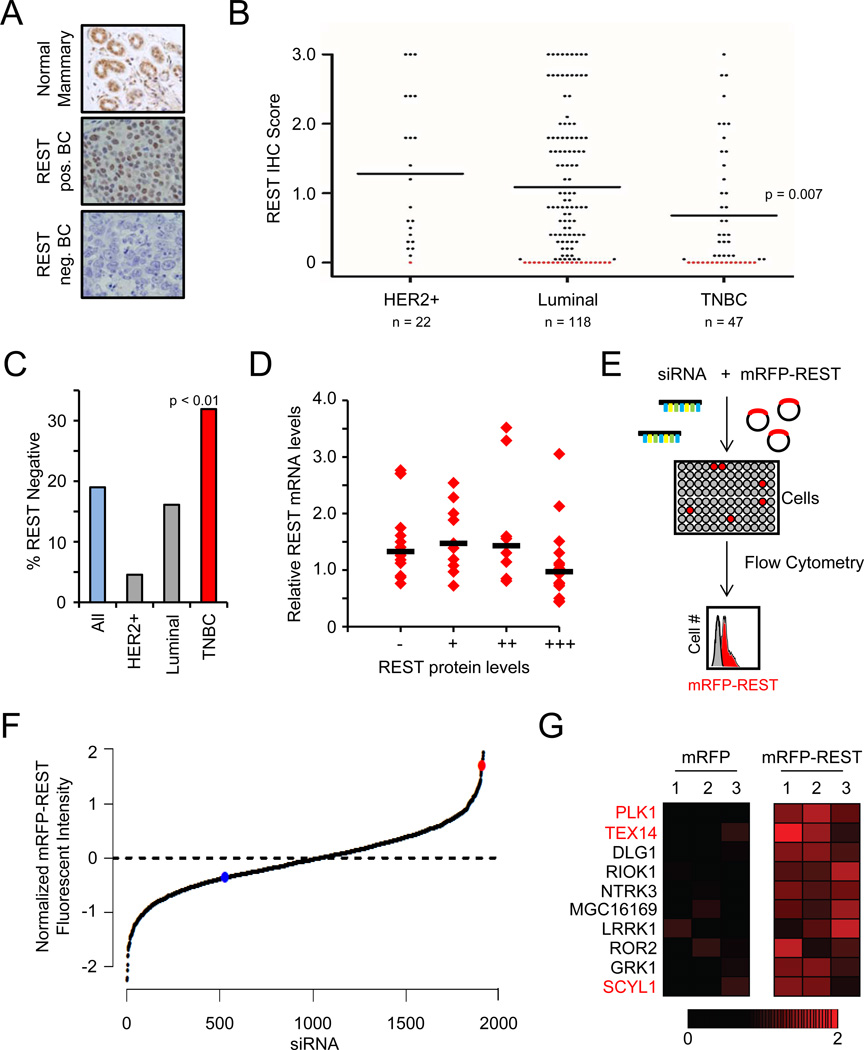
Analysis of REST protein expression. Representative images of normal mammary gland (top, n=8) and human tumors (n=185) exhibiting positive REST expression (middle panel) and lack of REST expression (bottom panel).
REST protein expression is frequently lost in human breast cancer. The REST IHC scores from A are plotted by disease subtype. Each dot represents a tumor; the black line represents the median. Red dots are tumors with REST IHC score = 0 (19%).
REST protein expression is frequently lost in TNBC. The percentage of tumors within each subtype with undetectable REST protein (REST IHC score = 0) is shown. TNBC = 32%
REST mRNA and protein levels are not correlated in primary human breast tumors. REST mRNA levels were analyzed in 50 primary breast tumors (from A). Each dot represents a tumor; the black bar represents the median.
RNAi-based screen for RDR genes. Cells were transfected with siRNAs targeting the kinome (3 siRNAs/gene) and the mRFP-REST or mRFP cDNA(n=4). Changes in fluorescence were assessed by flow cytometry.
Primary genetic screen for RDR candidates. The normalized effect of each siRNA on mRFP-REST fluorescence from the primary screen is shown. The red and blue dots are the mean of the positive control (siβTRCP) and negative control siRNAs, respectively.
Identification of RDR candidate genes. Heatmaps represent the effect (relative change in fluorescence) of individual siRNAs on mRFP fluorescence (left) and mRFP-REST fluorescence (right). The red gradient represents the relative change in mRFP-REST fluorescence. The genes for which multiple siRNAs increased REST abundance are shown and those for which multiple siRNAs increased REST abundance upon retesting are labeled in red.

