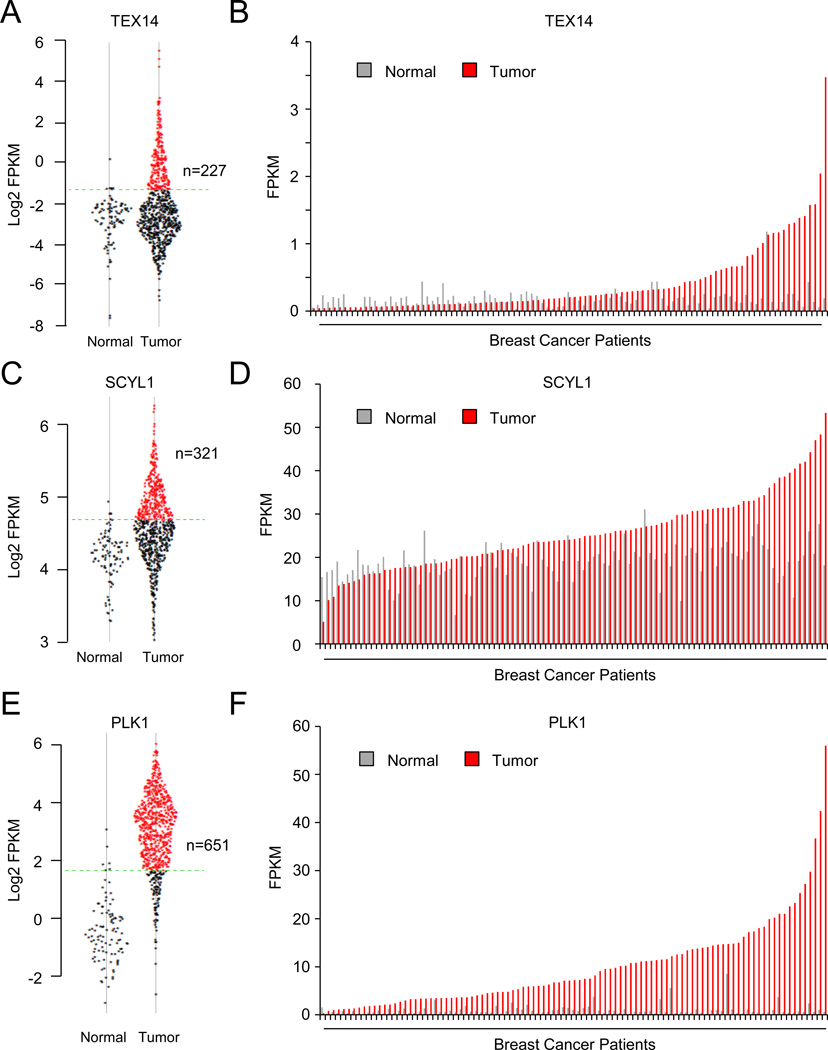
Figure 4. STP axis components are aberrantly over-expressed in human breast cancer compared to normal mammary tissue.
A,C,E. TEX14, SCYL1, and PLK1 expression in normal mammary tissue and breast tumors. Expression level of the indicated gene (represented as log2 FPKM (Fragments Per Kilobase per Million fragments mapped)) in each normal and tumor sample in the TCGA data set is plotted. The 95% confidence interval for the normal samples is represented by the green dashed line.
B,D,F. TEX14, SCYL1, and PLK1 expression is higher in tumors than matched normal. The expression level of the indicated gene for each tumor normal pair in the TCGA data set (represented as FPKM).

