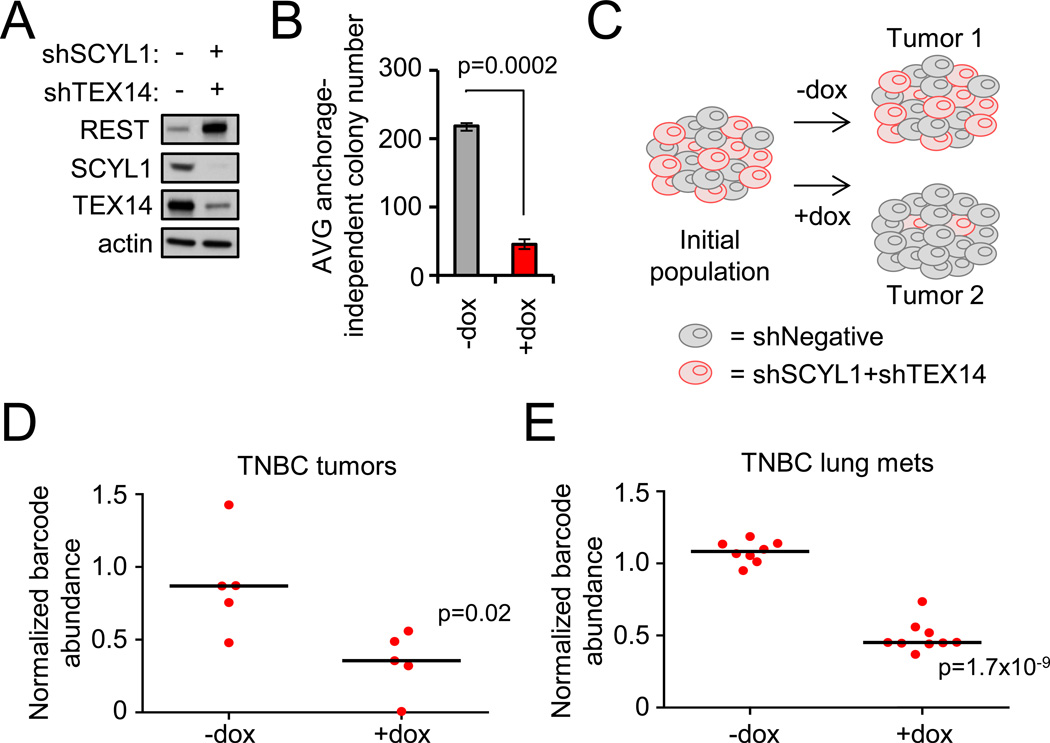
MDA-MB231-LM2 TNBC cells were engineered to inducibly co-express SCYL1 and TEX14 shRNAs. Protein levels were analyzed by western blot.
Depletion of SCYL1 and TEX14 impairs anchorage-independent growth. Cells from A were assessed for anchorage-independent growth. Data presented as mean +/− SE.
In vivo barcode-based competition assay schematic. MDA-MB231-LM2 cells expressing inducible negative control shRNA or combination-shTEX14+shSCYL1 were mixed at an equal ratio. This population was transplanted into mice, and tumors were allowed to form +/−dox. At the experimental end point, genomic DNA was collected, and the relative abundance of each cell population was quantified via barcode-qPCR-analysis.
Depletion of SCYL1 and TEX14 impairs primary tumor growth. The experiment was carried out as described in C. Barcode levels +/−dox are shown. Each dot represents an individual tumor. The black line represents the median.
Depletion of SCYL1 and TEX14 impairs metastatic progression. MDA-MB231-LM2 TNBC cells engineered to inducibly express SCYL1+TEX14 shRNAs or negative control shRNAs were mixed in equal ratio, intravenously injected, and monitored for lung metastatic growth +/− dox via bioluminescence imaging. Barcode-qPCR was performed on lung genoms the relative abundance of each cell population in the lung metastatic burden. Each dot represents lung metastases from an individual animal.

