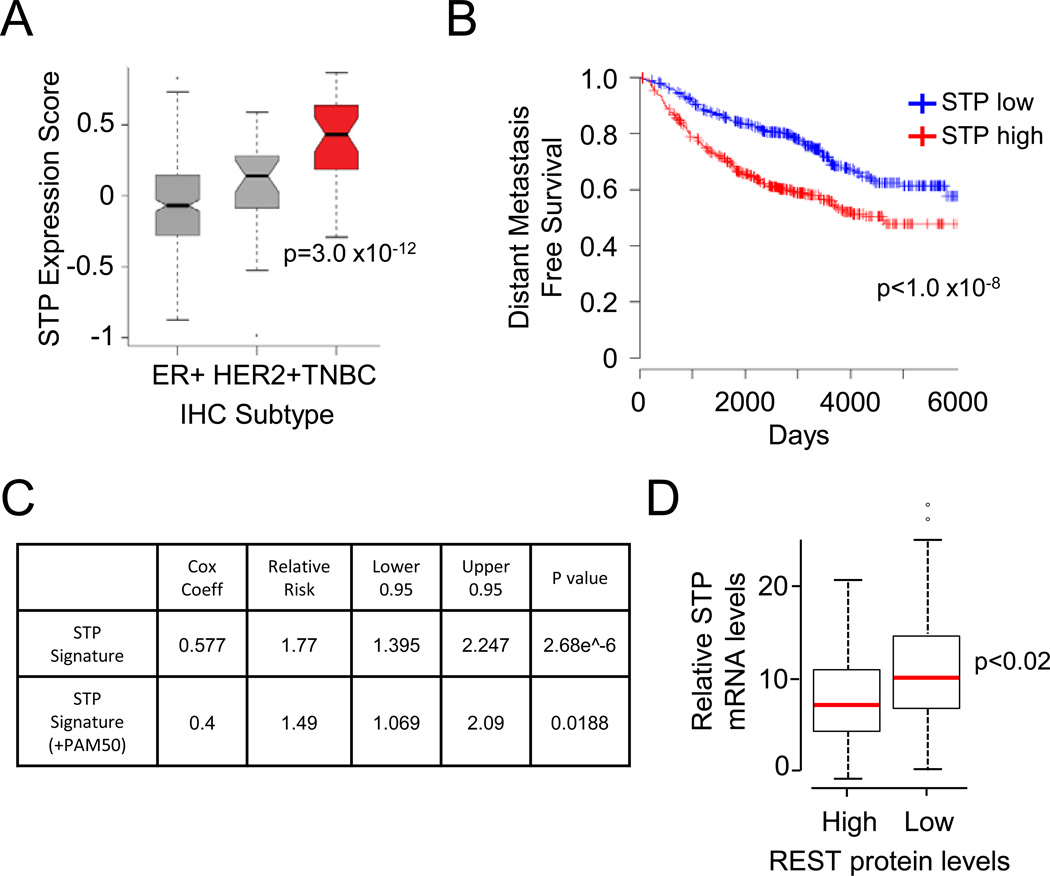
Figure 7. The STP axis correlates with low REST protein levels and poor patient outcome in human breast cancer.
- STP axis expression is correlated with TNBC subtype. The STP axis gene expression signature for each tumor was plotted by histologic subtype. The solid line represents the median. The boxes represent the 25th to 75th percentiles. Error bars represent 95% confidence interval. Outliers are represented as circles.
- STP axis expression correlates with poor patient outcome. Patients with the highest and lowest tertiles of STP axis gene expression signature are shown in red and blue, respectively (n=1151).
- STP axis expression correlates with increased metastatic recurrence in breast cancer patients. Hazard regression results for the STP expression signature are shown. Top: results for the STP signature alone. Bottom: results with an inference of PAM50 subtype.
- STP axis expression and REST protein levels are inversely correlated in human breast cancer. The normalized cumulative expression of SCYL1, TEX14, and PLK1 is shown for tumors exhibiting REST high and REST low protein (as determined by IHC). The red line represents the median. The boxes represent the 25th to 75th percentiles. Error bars represent 95% confidence interval. Outliers are represented as circles.

