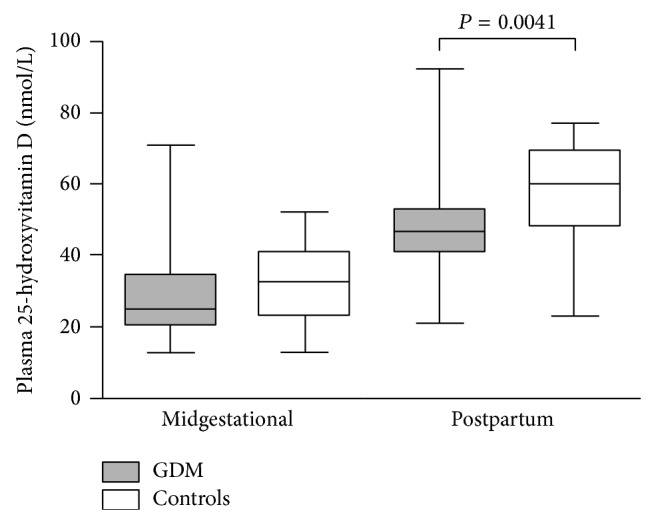
Figure 1.

Plasma 25(OH)D levels. Box and Whisker plots were constructed as medians, minimum, and maximum values and IQR. Differences in 25(OH)D levels between midgestational and postpartum values in each group were significant (both P < 5 × 10⁻⁶, Wilcoxon paired test, not shown in the graph).
