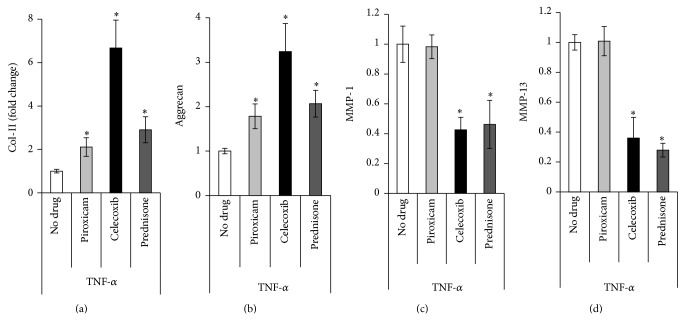
Figure 2.
Gene expression in vitro after treatment with TNF-α with or without additional drugs. Changes in CII (a), aggrecan (b), and MMP-13 (c) gene expression after treatment with TNF-α (5 ng/mL) with or without drug treatment. Gene expression after treatment with TNF-α only is set as the base case (equal to 1). Gene expression of the drug treated chondrocytes is relative to the “no drug” case which contains TNF-α but no drug treatment. (∗ indicates P < 0.05).

