
Figure 1.
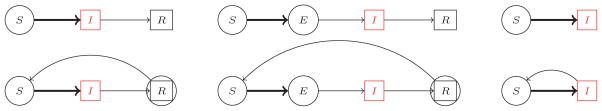
The models studied in this paper. Circles indicate the individuals who engage in mitigation behaviors. The red compartments indicate infectious individuals. Thick arrows indicate non-linear flow rates. Within the context of loss of immunity the recovered individuals may engage in some limited mitigation due to their inability to assess their own immunity.