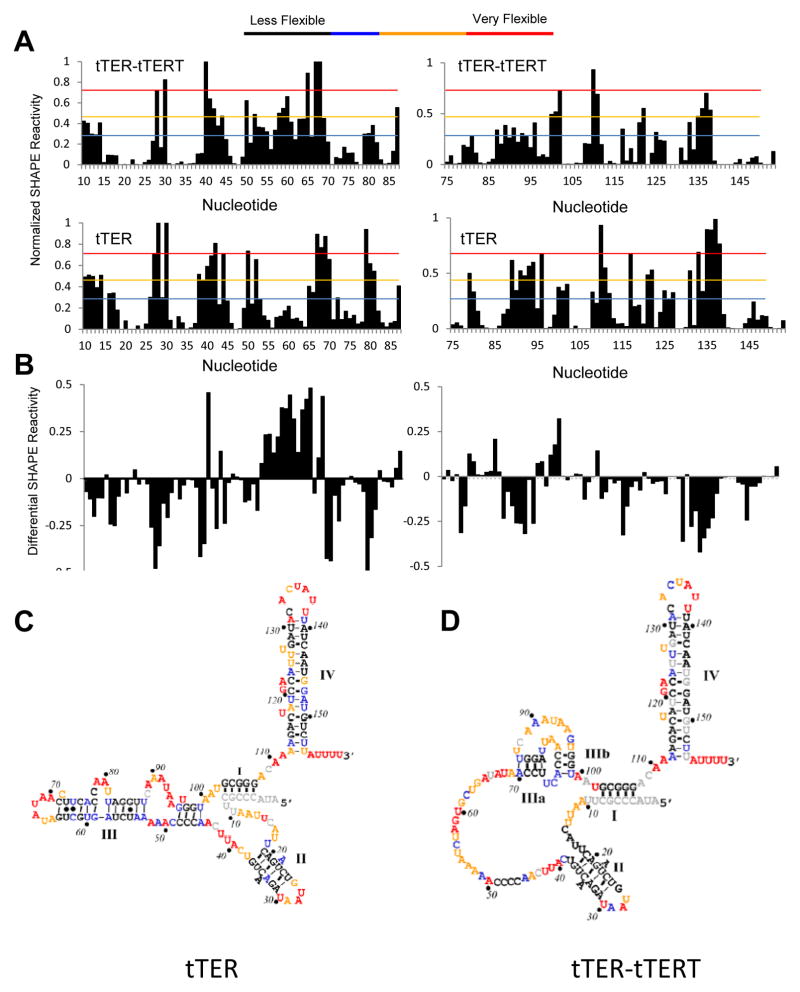
Figure 3.
SHAPE analysis of tTER in solution and bound to tTERT. Quantified data from SHAPE experiments were plotted versus nucleotide position. Data are for: (A) tTER bound to tTERT. (B) tTER in the absence of proteins. (C) Differential plot of SHAPE reactivities: tTER-tTERT minus free tTER reactivities. (D) Secondary structure of free tTER color coded for SHAPE reactivity. The structure was generated using RNAstructure. (E) Secondary structure of tTER bound to tTERT color coded for SHAPE reactivity. Stems I, II, and IV were generated using RNAstructure. The base-paring of the pseudoknot region was set manually. See Figure S1 of the supporting information for representative raw data.

