Figure 2.
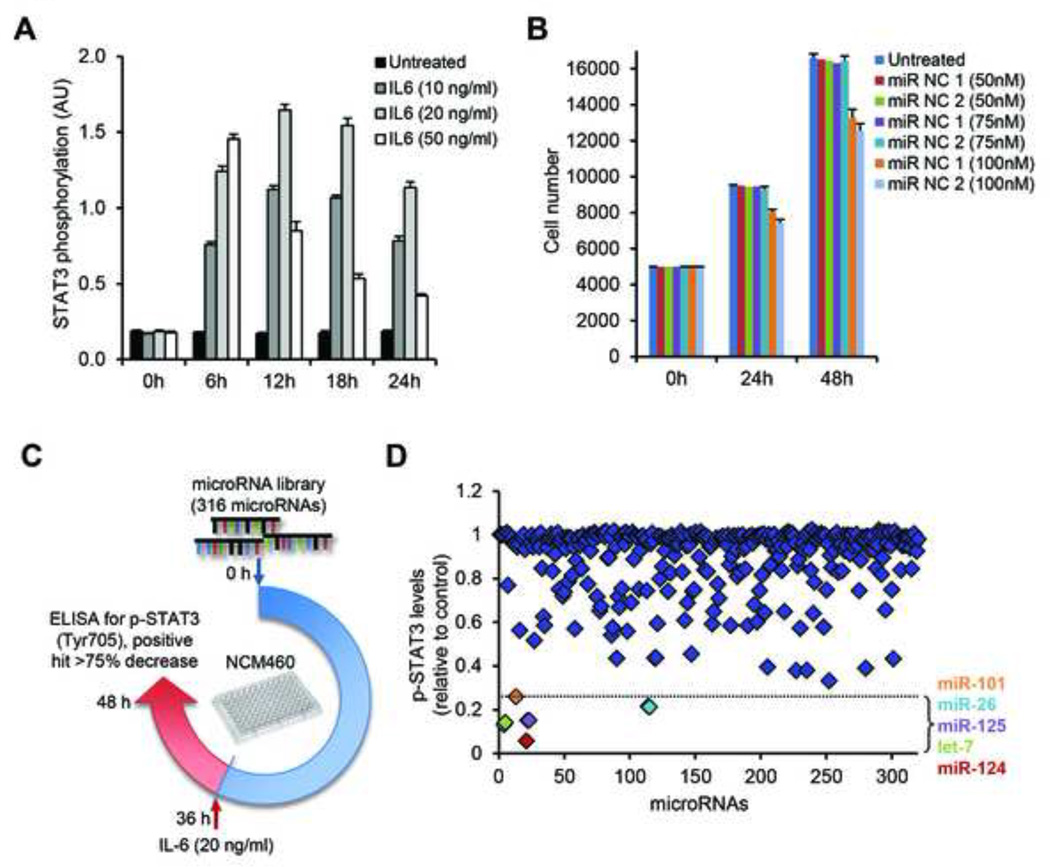
MicroRNA-library screen in NCM460 colonocytes. (A) Optimization of IL-6 treatment for time and dosage, as assessed for STAT3 phosphorylation, by ELISA assay. NCM460 cells were treated with 10, 20 and 50 ng/ml of IL-6 for 0, 6, 12, 18 and 24 hours. (B) Cell growth assays on NMC460 cells transfected with 50, 75 or 100 nM of microRNA negative controls (miR-NC 1 and miR-NC 2), as compared to untreated cells. (C) Schematic representation of the 316 microRNA-library screen and (D) the effect on p-STAT3 levels, after IL-6 treatment. NCM460 cells were transfected with the microRNA-library and activation with IL-6 (20 ng/ml) followed 36 hours later. Cells were harvested at 48 hours post-transfection and p-STAT3 levels were estimated. Data points correspond to each individual microRNA of the library. The dotted line indicates the 75%-decrease point, set as the cut-off for a positive hit. Positive hits are color-coded corresponding to the microRNAs indicated on the right-hand side of the panel, presented in the order of increasing p-STAT3 inhibition.

