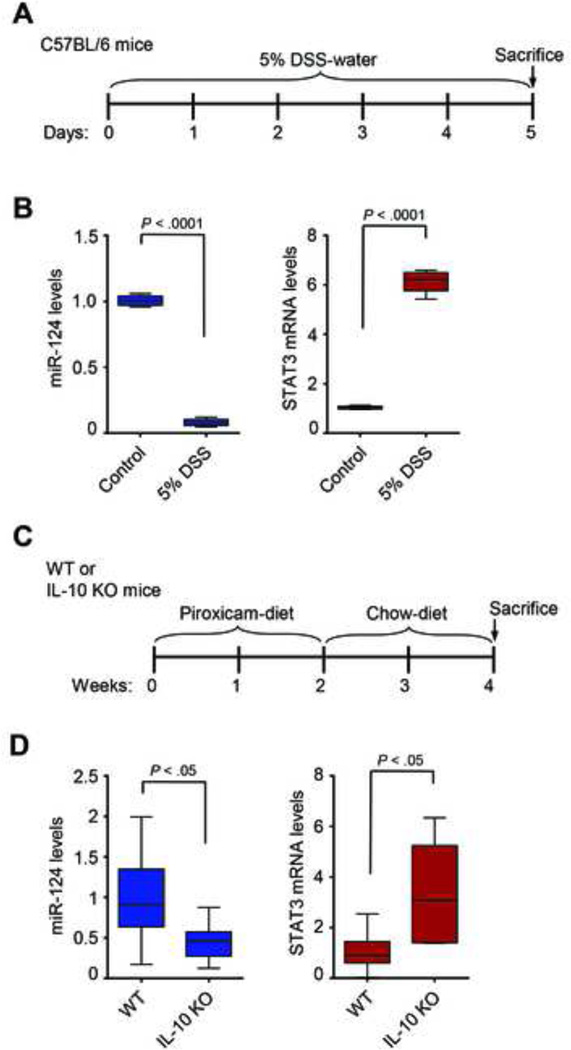
Figure 5.
MiR-124 and STAT3 expression levels in mouse models of experimental colitis. (A) Schematic representation of the protocol for the DSS-model in C57BL/6 mice. (B) The levels of miR-124 and STAT3 mRNA expression in colonic tissues of control (Control, n = 5) and DSS-treated mice (5% DSS, n = 5) were determined by real-time PCR. (C) Schematic representation of the experimental design for the IL-10 KO-colitis mouse model. (D) miR-124 and STAT3 expression levels in colonic tissues from WT and IL-10 KO mice (n = 7 per group) were determined by real-time PCR analysis. Data are presented as boxes with whiskers (minimum-to-maximum). (t-test, Prism6, GraphPad Software, Inc.).

