Figure 3.
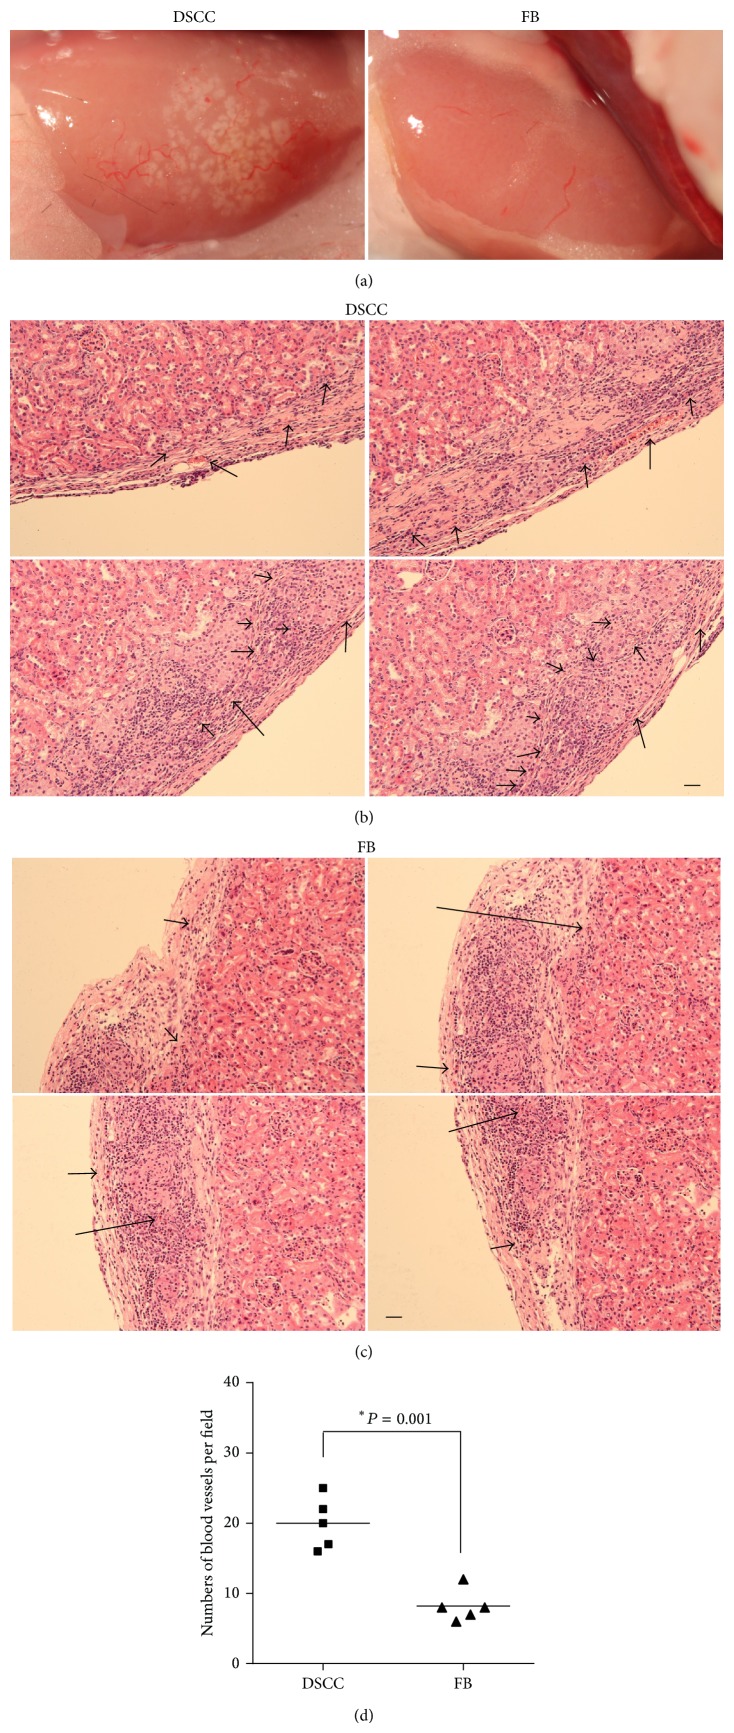
DSCC enhances angiogenesis. (a) Allografts are shown from groups 1 and 2 after 1 week of transplantation. We divided each graft image into 100 grids and counted the numbers of blood vessels in both groups. Higher numbers of blood vessels were observed in group 1 DSCC and islet allografts (left 18 ± 3%) compared with group 2 FB and islet allografts (right 8 ± 2%). Tissue sections of H&E staining are displayed from groups 1 (b) and 2 (c) one week after transplant. ((b) and (c)) Four images in each group consist of panoramic views of the graft. The numbers of big blood vessels (>50 μm diameter) were more in group 1 than in group 2 (4 ± 2% versus 1 ± 1%). Black arrows indicate the blood vessels. (d) Quantification of the blood vessels. Scale bar = 50 μm.

