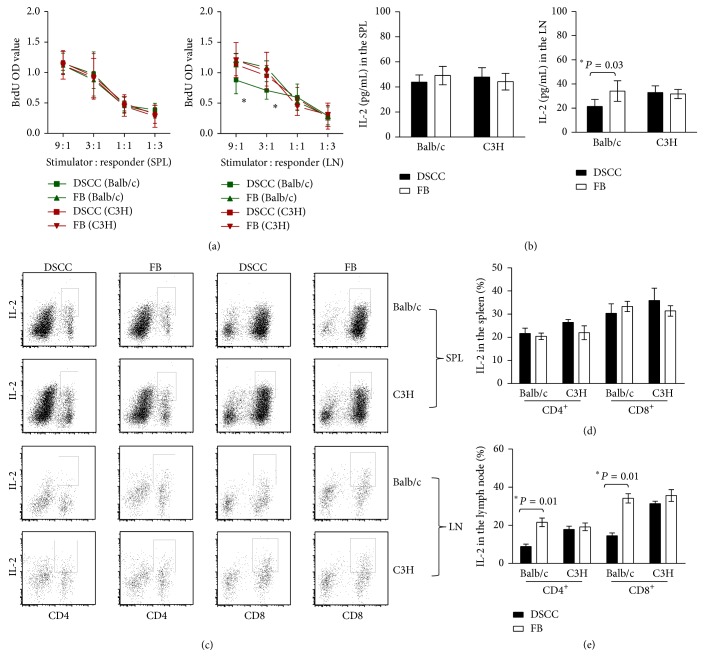
Figure 6.
DSCC protects transplanted islets without systemic immunosuppression. (a) Allogenic mixed-lymphocyte reaction (MLR) type assays of leukocytes from group 1 (DSCC) mice were compared with leukocytes from group 2 (FB) mice at week two after transplantation. The responses of the responders from group 1 (DSCC, square) and those of responders from group 2 (FB, triangle) B6 (H-2b) recipients to stimulator γ-irradiated-splenocytes (at 2500 rad) from Balb/c (left, H-2d) or C3H (right, H-2k, third party control) were tested at the indicated ratios after 4 days of incubation. Wells were pulsed with BrdU for the last day, and BrdU incorporation into DNA was measured in triplicates. There was no significant difference in the leukocyte responders from the spleen (left) or renal lymph nodes (right) of group 1 and group 2 mice in response to C3H derived splenocyte cell stimulation. ∗Significant differences between groups 1 and 2 renal lymph node leukocytes, but not splenic leukocytes, at stimulator/responder ratios of 9 : 1 (P < 0.04) and 3 : 1 (P < 0.01, n = 6) were noticed in response to Balb/c derived splenocyte stimulation. (b) The total amount of IL-2 secretion in the MLR culture was detected by ELISA and expressed in pg/mL. No significantly different IL-2 secretion was observed in response to C3H derived splenocyte cell stimulation in the two groups. Significant differences in IL-2 secretion were observed between groups 1 and 2 renal lymph node derived leukocyte cell cultures, but no difference was observed in spleen derived leukocytes in response to Balb/c derived splenocyte stimulation. (c) Representative dot plots of IL-2 production in CD4+ (left) or CD8+ (right) cells are presented from flow cytometric analysis. Accumulating data were calculated based on 3 independent experiments of 6 mice in total per group. (e) A significant decrease of IL-2 expression in both CD4+ and CD8+ subsets from renal lymph nodes from group 1 (DSCC) compared with group 2 (FB) was noticed in response to Balb/c but not C3H derived splenocytes. (d) No significant difference was identified in the spleen cells in response to either Balb/c or C3H splenocyte stimulation. Each dot represents one mouse. ∗ P < 0.05.

