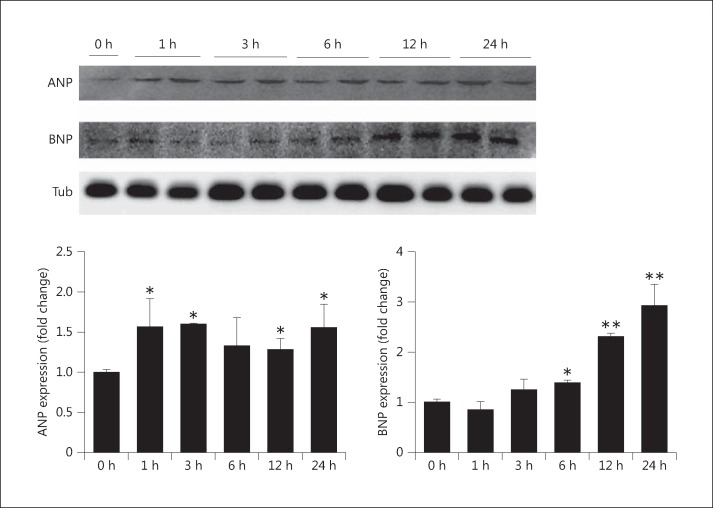
Fig. 2.
Expression of pathologic markers (ANP and BNP) in elevated phosphate-induced myocardial cells. The expression levels of ANP and BNP with 1.4 mM NaH2PO4 were measured by immunoblotting with antibodies against proteins as indicated. The results are expressed as the mean ± SE values of 3 experiments. * p < 0.05, ** p < 0.01 in comparison to the control. Tub = α-Tubulin.

