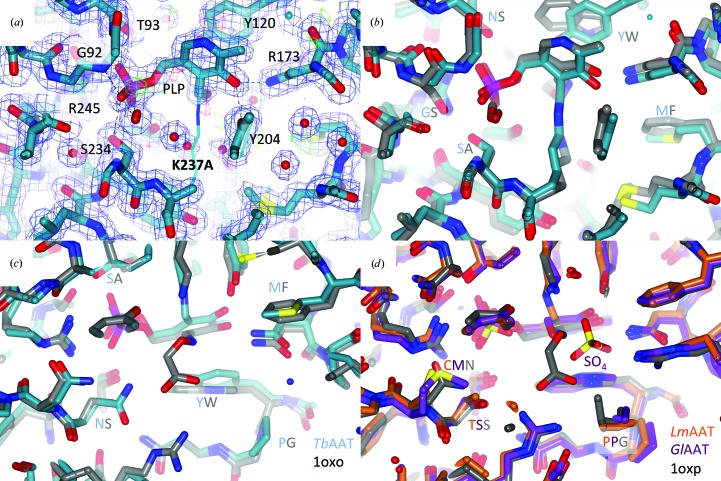
Figure 2.
Active site. (a) compares the PLP-binding sites of TbAAT-native (thin lines) and TbAAT-K237A (thick lines). The σA-weighted 2F o − F c (blue) and F o − F c maps (green for positive, red for negative) for TbAAT-K237A are shown at 1σ and 3σ levels, respectively. PLP engages in a number of hydrogen bonds and hydrophobic interactions. These residues are labeled. The density for PLP in the K237A mutant is very clear. The two active sites are virtually identical. (b) shows a superposition of TbAAT (blue C atoms) and the open form of chicken mitochondria AAT (gray C atoms; PDB entry 1oxo) around the PLP-binding site. The structures are virtually identical. Mutations are subtle and are highlighted: for instance, ‘YW’ means that Tyr126 in TbAAT is Trp in chicken mitochondria AAT. The substrate-binding sites are also very similar. (c) is a rotated view of (b). In (d) LmAAT (orange C atoms), GlAAT (purple C atoms) and the closed form of chicken mitochondria AAT (gray C atoms; PDB entry 1oxp) are superimposed. Here again the differences are subtle. This figure was created with CCP4mg (McNicholas et al., 2011 ▶).

