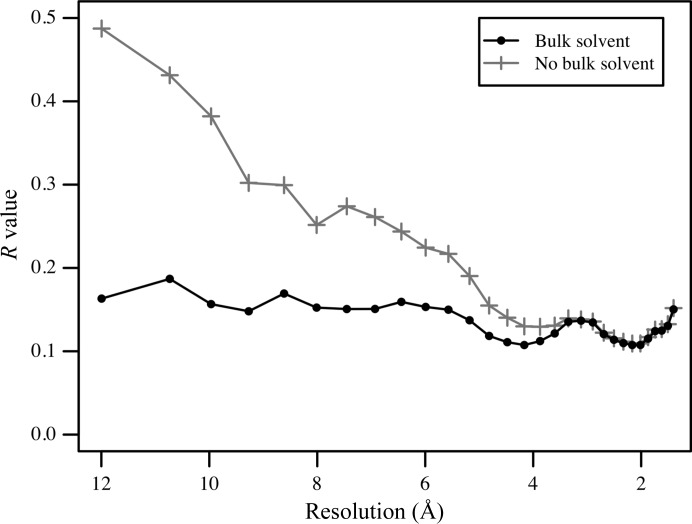
Figure 3.
Example of the bulk-solvent contribution to the R value shown by resolution for PDB entry 3fo3 (Trofimov et al., 2010 ▶). Solid black and grey curves show the effect of including (lower R values) versus not including (higher R values) the bulk-solvent contribution to the total model structure factors.

