
Figure 1.
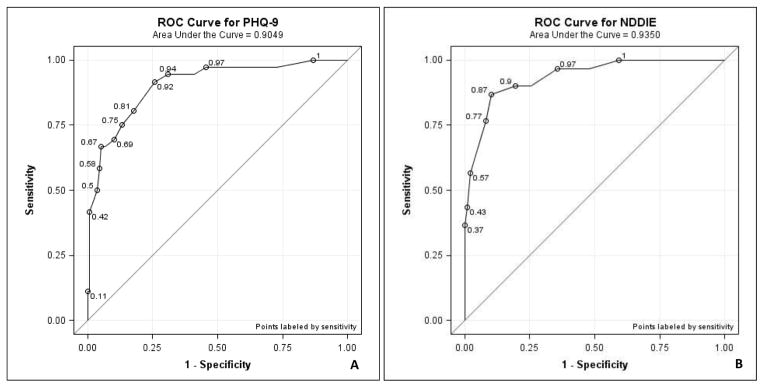
A. the PHQ-9 receiver operating characteristic (ROC) curve. Points on the curve from left to right represent sensitivity and specificity at PHQ-9 scores of 23, 18, 17, 16, 15, 13, 12, 11, 10, 9, 6, and 1, respectively.
B. ROC curve for the NDDI-E. Points on the curve from left to right represent sensitivity and specificity at NDDI-E cut-points of 19, 18, 17, 16, 15, 14, 12, and 9, respectively.