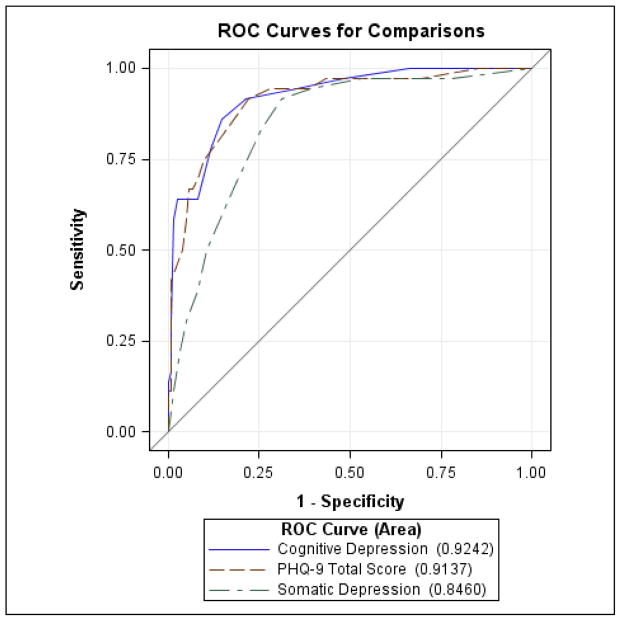
Figure 2.
Comparison of areas under the ROC curves of PHQ-9 total and somatic and cognitive/affective subscale scores. The estimated difference in ROC area between PHQ-9 total score and cognitive/affective is 0.011 with standard error as 0.012 and 95% Wald confidence interval as (−0.013, 0.034) and the difference is not significant (p = 0.378). The estimated difference in ROC area between PHQ-9 total score and the somatic components only is 0.068 with standard error as 0.016 and 95% Wald confidence interval as (0.036, 0.10) and the difference is statistically significant (p < 0.0001). The estimated difference in ROC area between cognitive/affective and somatic is 0.078 with standard error as 0.026 and 95% Wald confidence interval as (0.028, 0.128) and the difference is statistically significant (p = 0.002).

