
Figure 4. Fear conditioning.
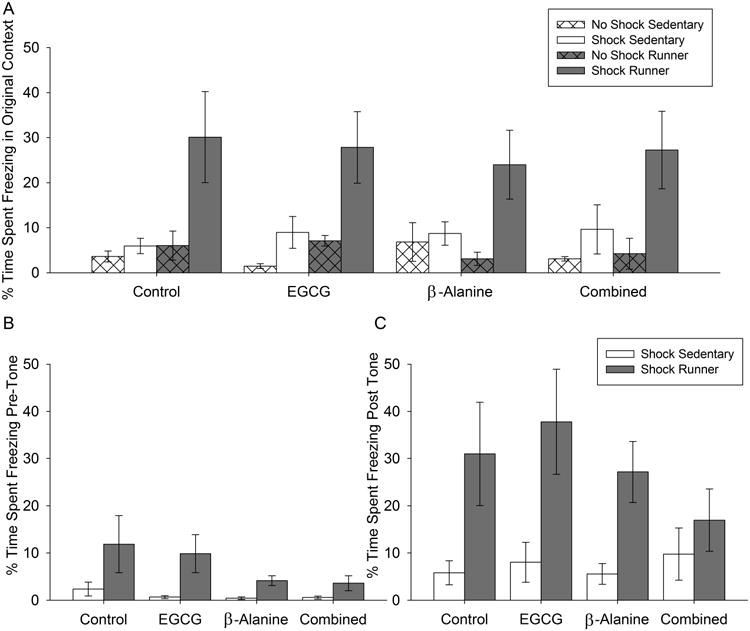
A) Average duration freezing in the original context on day 2 of the procedure expressed as percentage of total duration of the test, with separate bars for each treatment group. B) Average duration freezing in the novel context on day 2 before the tone was presented. C) Same as B but during the period after the tone was presented. Standard error bars are shown (n=2-3 per group for no-shock controls; n=8-9 for shock groups).