
Figure 5. New cells in the dentate gyrus of the hippocampus.
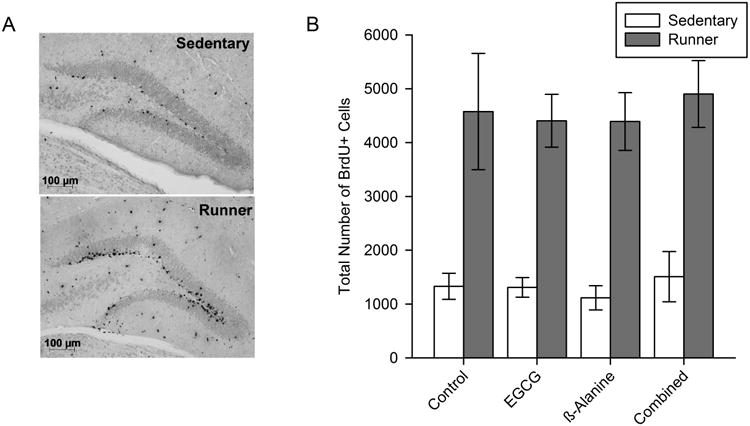
A) Representative microscopic image of a brain section stained for BrdU revealing new cells (born during the first 10 days of the study and still survived 1 month later) in the granule layer of the dentate gyrus. B) Average total number of BrdU+ cells in the granule layer of the dentate gyrus. Standard error bars are shown (n=9-12 per group).