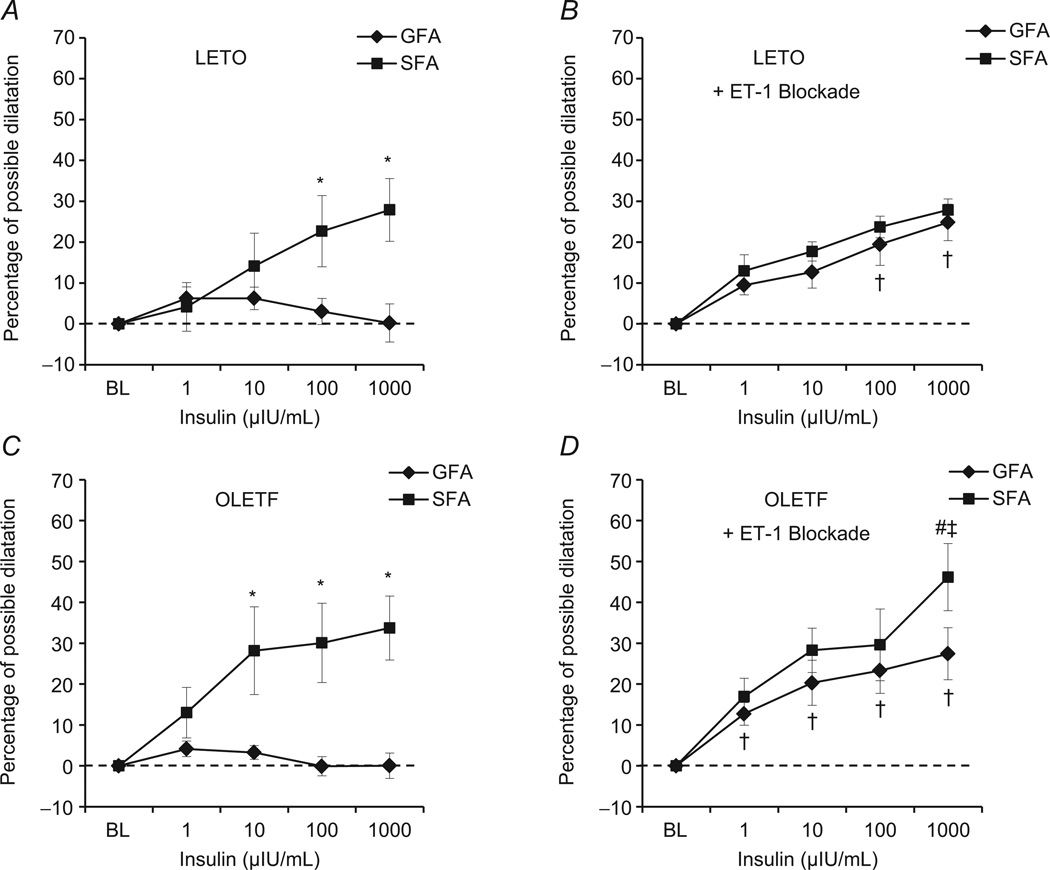
Figure 2. Insulin-induced vascular reactivity in SFA and GFA of Long–Evans Tokushima Otsuka (LETO; A and B) and Otsuka Long–Evans Tokushima fatty (OLETF) rats (C and D).
Left panels (A and C) present data from insulin dose–response curves performed in control condtions (i.e. insulin alone), and right panels (B and D) present data from insulin dose–response curves in the presence of 3 µm tezosentan, a non-specific inhibitor of endothelin-1 (ET-1) receptors. *Significant difference between vessels, within group (P < 0.05). †Significant effect of ET-1 blockade within vessel, within group (P < 0.05). #Significant difference between groups, within vessel in ET-1 blockade condition (P < 0.05). ‡Significant difference between vessels, within group in ET-1 blockade condition (P < 0.05).

