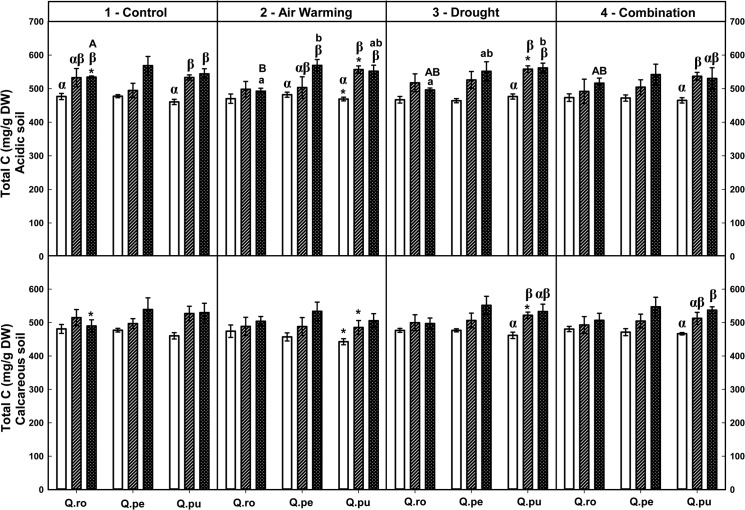
Fig 3. Foliar total C of three oak species exposed to different climate treatments and soil types during a drought-rewetting-drought course.
Vertical bar charts show mean and standard error and the bar charts were grouped for each species, in each treatment and soil type. Periods are indicated from left to right side: white bar = the first drought period (1stD), hedged bar = the rewetting period (RW), cyclone bar = the second drought period (2ndD). Different small letters indicate significant differences across three oak species within each climate treatment, period and soil type. Different capital letters indicate significant differences across different climate treatments for each species, period and soil type. Greek symbols indicate significant differences across the different drought-rewetting-drought periods for each species, climate treatment and soil type. Asterisks indicate significant differences between acidic and calcareous soil within each climate treatment, species and time course (P ≤ 0.050).

