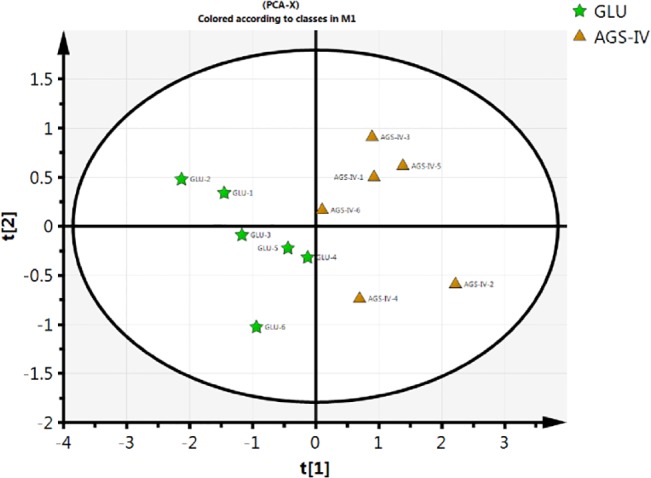
Fig 3. Score plot of PCA performed on the spectral count data of glutamate-treated groups (GLUs) and AGS-IV-treated groups (AGS-IVs) (Pentagram, GLUs; Triangle, AGS-IVs).

Proteins meet the following filter criteria were included for PCA: (1) the number of unique peptide identified more than 2; (2) protein identified at least four out of six samples; (3) statistical significance (P < 0.05) were obtained by Student’s t-test (GLUs and AGS-IVs).
