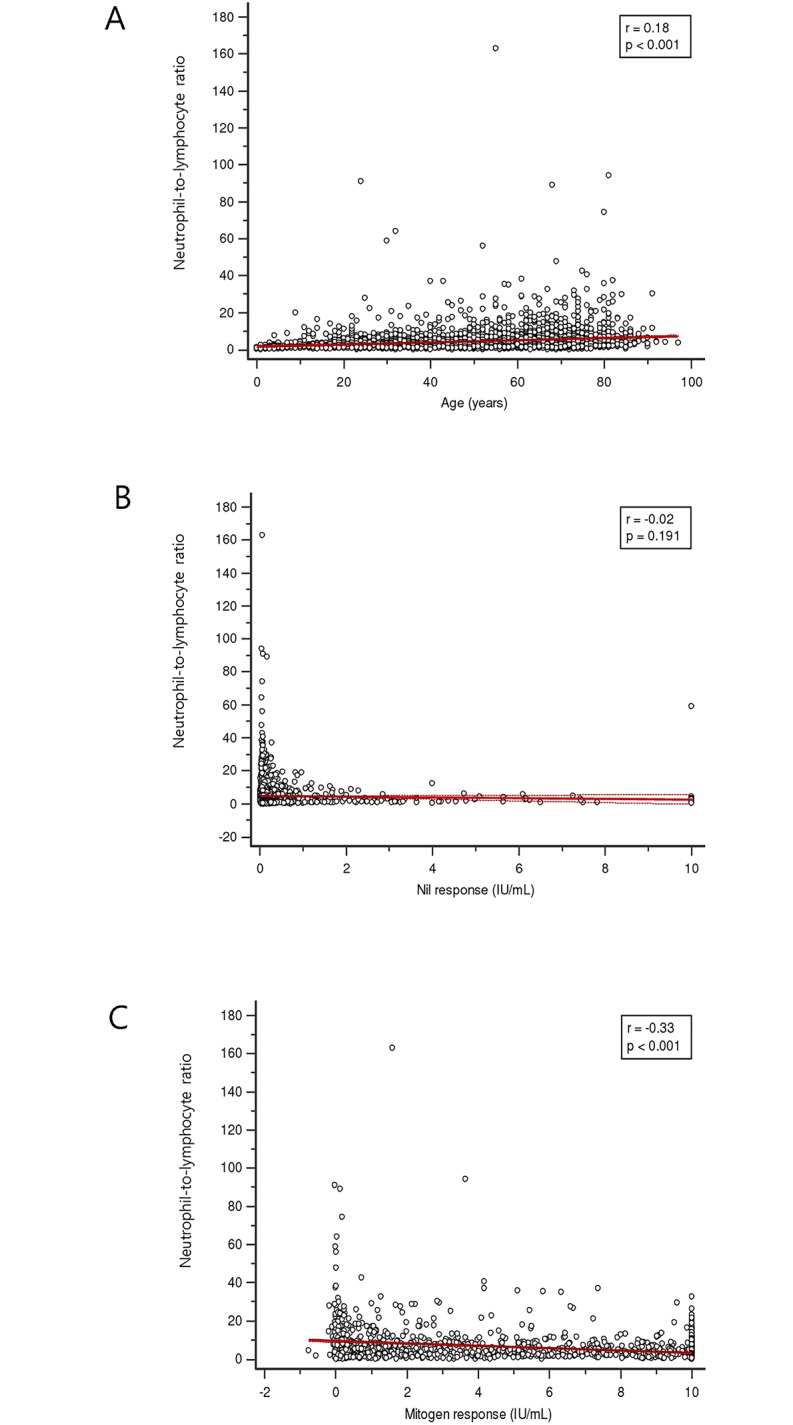
Fig 4. Correlation between the neutrophil-to-lymphocyte ratio (NLR) and variables.

(n = 2773) (A) Age. The dotted lines indicate the 95% confidence interval. (B) Nil response in QuantiFERON-TB Gold In-Tube (QFT-GIT) assay. Nil response indicates the concentration of interferon-γ in plasma from unstimulated blood. (C) Mitogen response in QFT-GIT assay. Mitogen response is calculated interferon-γ in plasma from phytohemagglutinin stimulated minus nil. The NLR shows a weak positive correlation with age and a weak negative correlation with mitogen response.
