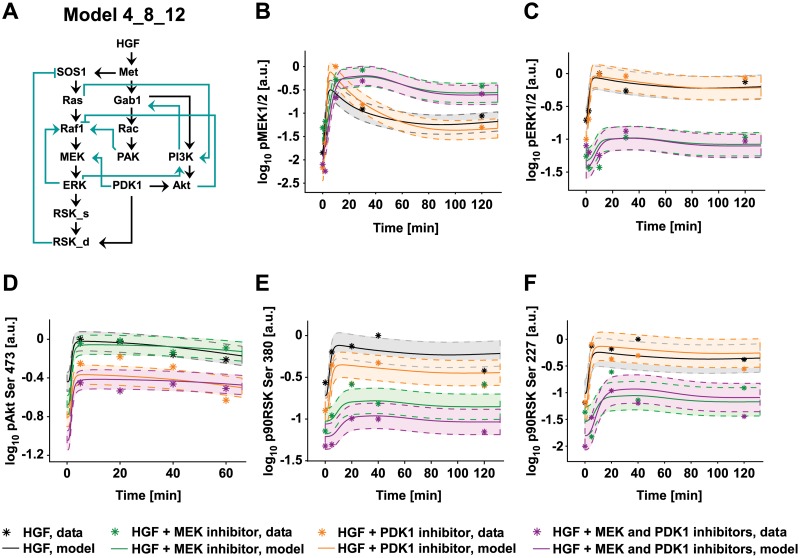
Fig 6. ODE model fit.
A) Structure of the best performing model 4_8_12. B-F) Plots showing representative model trajectories (solid lines) of the phosphorylation kinetic of the indicated proteins measured by quantitative immunoblotting in primary mouse hepatocytes pretreated with the indicated inhibitors and stimulated with 40 ng/ml of HGF for the indicated time (stars). y-axes show the concentration of the respective measured protein in arbitrary units on a logarithmic scale. The shadowed area surrounding the model trajectory represents the confidence interval delimited by the dashed line. Treatments are color-coded as indicated in the figure.

