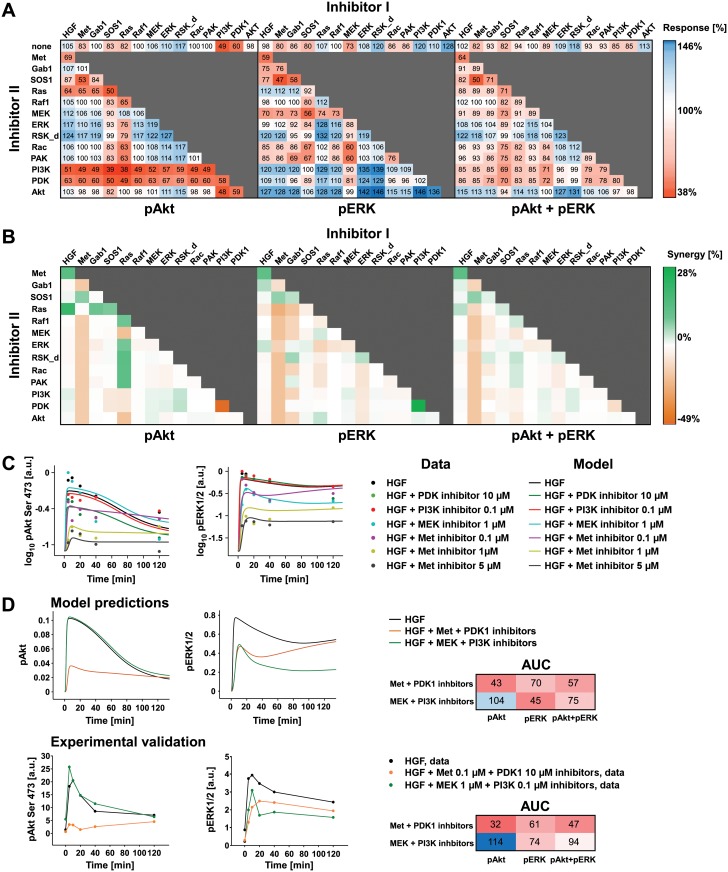
Fig 8. Inhibitor combination: model predictions and experimental validation.
A) Heatmaps showing model simulations of the impact of 50% inhibitor I individually or in combination with 50% inhibitor II. As readout, the area under the curve of pAkt, pERK, and the sum of pAkt and pERK upon inhibitor treatment is compared to the area under the curve of the control condition. The change in the response induced by the inhibitor treatment is indicated as percentage to the control condition. B) Heatmap of synergistic effect of inhibitor combination treatment shown in panel (A). The synergy represents the efficiency of the double inhibitor treatment compared to individual inhibitor treatments. C) Inhibitor strength parameter estimation. Model 4_8_12 trajectories (solid lines) of the phosphorylation kinetic of pAkt and pERK measured in primary mouse hepatocytes treated with the indicated inhibitor or DMSO prior to HGF 40 ng/ml treatment (filled circles). The experimental data represent the average of two or more replica. D) Model predictions of pAkt and pERK kinetics and experimental validation of inhibitors combination treatment. Model predictions are based on the inhibitor strength estimated as in Fig 5C. The experimental validation is based on primary mouse hepatocytes treated with the indicated inhibitors or DMSO and subsequently stimulated with 40 ng/ml HGF for the indicated time points. Quantification of the phosphorylation kinetics of Akt and ERK determined by quantitative immunoblotting (S12 Fig). Quantification of the area under the curve (AUC) of pAkt, pERK and their sum is indicated for the model trajectories and the experimental data. The experimental data is a representative dataset of an experiment performed in biological duplicates.

