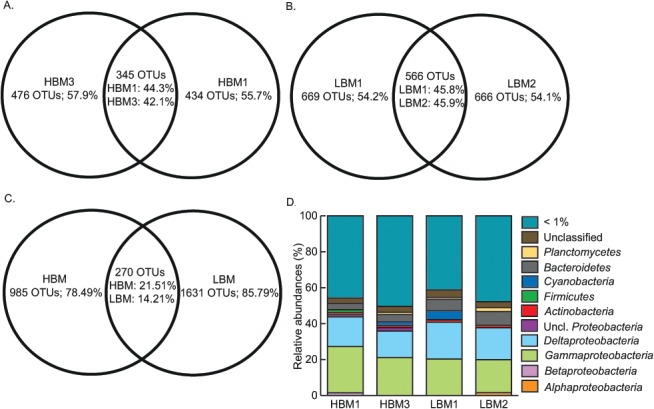
Fig 2. Distribution of 16S rRNA gene OTUs.

A-C, Venn diagrams representing the number of observed OTUs for the 16S rRNA gene. Comparisons are shown between (A) HBM replicates, (B) LBM replicates, (C) HBM (n = 2) and LBM (n = 2) samples. The number and percentage of unique and shared OTUs are given. D, The relative abundance of abundant 16S rRNA derived OTUs, grouped per phylum, from HBM (n = 2) and LBM (n = 2) sediment samples. Sequences were assigned to OTUs using sequence dissimilarity treshold of 3%. All OTUs with a relative abundance below 1% were grouped. Uncl. stands for unclassified.
